Data analyst jobs are in high demand, not just in the software space, but across every industry. Basically every business wants to use data to drive insight, so they're investing in data analytics and the people who make data analytics possible.
For people who aren't in the know, though, it can be difficult to see the point in investing in data analytics. It's not always easy to tell what data analytics even is, or what a data analyst does. This can reduce executive's willingness to invest in data analytics, since it's unclear what services they're even buying.
Much of the institutional skepticism towards data analytics comes from the fact that data analytics is a black box in many organizations. Businesses hand data to their data analytics team, then they get insight back. Often, managers and executives aren't aware of what goes into data analytics, so they don't have any idea what that internal process looks like.
This leads to a perception that data analysts aren't 'earning their keep', so to speak. This is especially true with the high wages most data analysts receive. If executives don't think their data analysts are particularly valuable, they'll be less motivated to make their data analyst positions competitive, and get less qualified applicants as a result.
This leads to a vicious cycle, where less interested businesses get less qualified data analysts. Those less qualified analysts produce less valuable insight, which makes data analytics less valuable to the business. Managers and executives see that their data analysts aren't producing valuable insight, and their perception of data analysts gets even lower.
Just like with other business-critical positions, businesses that want to access the best data analytics should expect to pay a premium for the data analysts that can perform them. Investment in data analytics is often one of the most valuable investments that a business can make.
To really understand why data analysts are so valuable, managers and executives need to understand what they do, and how what they do translates into benefits for the organization. This way, businesses can be more mindful of the value that their data analysts bring.
What is data analytics?
Before managers and executives can understand what a data analyst does, they first need to understand what data analytics even is. There are still many business leaders that don't know what data analytics is and why it can be so valuable.
Data analytics is the analysis of data to answer specific questions. Data analysts collect, transform, model, and visualize data in an attempt to find insight and answer crucial business questions.
This doesn't just cover the data modeling stage, where a data analyst will attempt to find trends and relationships in their data by applying different statistical models. Data analytics covers the whole data process, from when the data is first collected to when it's been visualized and shared with an audience.
Data analytics differs from regular data analysis in one key way. Regular data analysis attempts to find trends and relationships in data, but it doesn't aim to find answers to specific questions. Data analytics goes into analysis with questions in mind, and uses data to find answers.
What does a data analyst do?
It can be hard to figure out how data analysts play into all of this. Since managers and executives usually receive pre-made dashboards and visualizations instead of making their own, it's very easy for them to minimize the contributions of data analysts in making those visualizations.
A data analyst's job doesn't start at the dashboarding stage, and often, their relationship with the data doesn't end even after it's been visualized and shared for the first time. It's a complex job that requires expertise at every step of the process.
At every step of the data process, there's a data analyst there to make sure that the process is going smoothly and there haven't been any mistakes. It's their job to shepherd data through the analytics process, so that it's as frictionless as possible to gain insight from the finished process.
In the past, data analysts had to do much of this work manually, but BI tools help to streamline the process. Now, much of what a data analyst does to a data set is mediated through their BI tool.
Data analytics has become much easier since the advent of powerful, robust BI tools. Though data analysis usually doesn't require the same amount of work that it once did, analysts still need a good understanding of data and how it can be transformed and modeled to perform effective analysis.
The data process
Data analysts can't take the raw data that's outputted by a business tool and immediately use it to build dashboards and visualizations. Raw data has all sorts of flaws and mistakes that make it hard to draw effective insight from.
A data analyst has to take raw data, funnel it all into their BI tool, and transform it into cleaned, standardized data that can then be leveraged for insight. After that, they apply statistical models to the data to find trends and relationships, and then visualize those trends for widespread use.
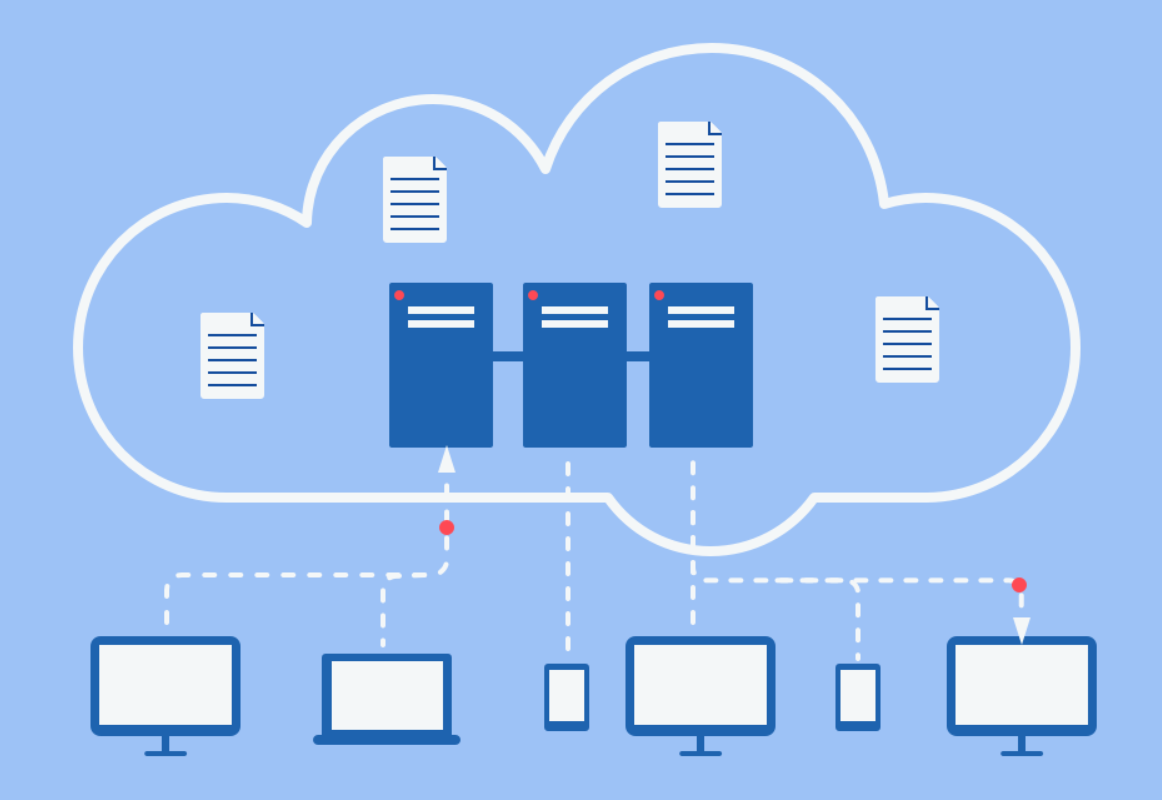
The first step is data collection. Data analysts help their IT team to connect all of their business software to their BI tool, so that data can flow freely and automatically. If their business doesn't have dedicated IT, the data analyst is usually responsible for this part themselves.
BI tools rely on a network of data connections and integrations to pull data out of other pieces of software and store it within the BI tool itself. These connections are usually fairly robust and easy-to-use, but there can be complications that require technical expertise.
Once data has been pulled out of its original software, it's time for data analysts to transform the data. Data transformation is a complex topic; we'll only touch on the basics here.
In short, data transformation is taking the raw data from a piece of software and changing, editing, and reformatting it into an actually usable state. This process can have several steps, depending on how much the data needs to be transformed and what the data will be used for.
Data usually needs to be cleaned; in this process, duplicate, inaccurate, or irrelevant entries are removed or amended. Data also needs to be standardized; in this process, data entries that are ambiguous or abbreviated are reformatted into a consistent style.
There are other transformations that might be applied, depending on the needs of the data. This is also the part of the process where data sets are joined, appended, updated, or replaced entirely. This is often the most technical part of the data process, and data analysts usually need some understanding of SQL to transform data correctly.
Once the data has been transformed into a more useful format, it's time for the data analyst to perform statistical modeling on the data in an attempt to find insight. Often, this step of the process happens in conjunction with the data visualization stage, especially in BI tools that allow for ad-hoc analysis.
During this stage, data analysts apply statistical models to their data to find trends and relationships. Sometimes, this is as simple as graphing a variable over time to see how it's trending. Other times, data analysts might apply regression models, do best-fit analysis, or perform forecasting models to find relationships and predict trends.
In a lot of writing on BI, this part of the process is called 'data analysis'. While it's only part of the entire data analysis process, it's fairly common to refer to just this step of the process as data analysis, since many BI tools allow end users to perform this sort of analysis ad-hoc without transforming their data.
After the data analyst figures out what sort of model best answers their question, it's time to visualize their data. In many BI tools, visualization is a more automatic process, and users can't really model their data without visualizing it at the same time. However, there's still a lot of opportunity for input at this stage.
Users often have more nuance over how they want to show their data beyond simple line charts and bar graphs. They can usually edit parts of their graphs to better display the data, customize the colors and other visual components of the graph, and add drill paths that help to better put the data in context.
From there, data analysts share their visualizations with the people who need it, place it into dashboards for better insight, or export their visualizations for use in reports or presentations. In many tools, the end user has more input than the data analysis at this stage.
Data analytics is an iterative process; the data analyst might redo work at any point in the chain to make their data more accurate, fix an issue, or answer a related question. Once they've handed off their data to the end user, data analysts are still responsible for ensuring that the data remains correct and valuable.
Conclusion
Data analytics is a complex job, and data analysts end up doing tons of work to make data fit for insight. They manage data at every point of the data process to ensure that the data that gets to the end user is correct and valuable.
There are many points during the data process where analysts need to use their technical skills to effectively shepherd their data along. There are also many points where they have to use their own best judgment, in how best to transform or model their data.
Data analysts are extremely valuable to businesses, since they help businesses to get actionable insight out of the data that they collect. With a better understanding of what a data analyst actually does, managers and executives can understand why it's so important to invest resources into data analysts.