In most cases, a business can anticipate generally what sort of information they'll need to solve their most common and frequent business problems. To solve these problems, businesses will usually generate the same handful of data reports every time the problem occurs.
Usually, these reports will be generated in some programmatic way by a piece of business software or by an IT department. They're usually generated on some sort of schedule, like a daily or weekly report, and the average employee rarely knows how or has the authority to generate them themselves.
The content of these reports will change with the data, but they're going to always have the same kind of data. End users usually can't change what sort of information they receive in these reports; that's usually baked right into their reporting software or determined by their IT department.
This is a fairly reliable way to handle business questions, and it makes it very easy for businesses to quickly solve their problems in a consistent way. However, there are some issues with this approach.
First, this approach limits the ways that businesses can solve their most common problems. If a business constantly looks at the same kinds of information to solve their problems, they're always going to settle on the same solutions. There might be other, more effective solutions to their problem that would be visible using different data or analysis. If a business always uses the same reports, they won't be able to see these solutions.
Second, this approach limits the sort of problems that can easily be solved. If a business relies on their reports to solve problems, and a problem crops up that isn't easily solved by one of their reports, they won't be able to solve that problem effectively.
Lastly, this approach isn't user-driven. The average user doesn't have a lot of input in what's included in their reports. They usually can't change much about the reports they recieve. If they wanted to look at data in a new way, it would be very hard to do so.
These limitations make generated reports a very poor choice for utilizing data in an agile, effective way. Businesses that use this sort of data strategy are very restricted in how useful their data can be. Those that want to take a more data-driven approach need another solution.
Ad-hoc reporting is a data reporting approach that allows the average user to create and generate their own reports based off of any data that they might have access to. It's a far more agile and casual approach than traditional generated reports.
This isn't just the ability to run reports at any time. To truly be ad-hoc, users should have the ability to run reports themselves, be able to customize what sort of information goes into reports, and run those reports at any time.
With ad-hoc reporting, businesses shift the responsibility of creating and generating new reports from their business software and IT department to the employees who actually need the reports. This way, reports can be tailored to the situation at hand and can be much more useful.
Users that want to solve new business questions can do data analysis ad-hoc to find answers. They can look at data from their old reports in new ways, or they can create completely new reports that answer completely new questions.
Ad-hoc reporting can also help to find new solutions to frequent business problems. Users can create new reports to solve old problems, and provide novel solutions that bring new benefits.
How do I access ad-hoc reporting?
The average piece of business software only rarely allows its users to do ad-hoc analysis and generate ad-hoc, customized reports. To access ad-hoc reporting, businesses usually need to invest in a business intelligence tool.
Among BI tools, though, ad-hoc analytics is one of the most common use cases. Most, if not all, BI tools will allow their users to do ad-hoc analytics and run ad-hoc reports.
Within a BI tool, users can generally build whatever sort of report they'd like to, as long as they have access to the data that they'd like to use. Since ad-hoc reporting is such an integral part of a BI tool, the processes for building out new reports is usually very simple. It's usually very easy to use these tools, even without much experience with a given BI system.
Since a business intelligence tool connects to many different pieces of software on an organization's network, employees can use the tool to generate reports that use multiple different pieces of software as sources. For example, a sales manager could analyze their Salesforce data in conjunction with Quickbooks data to gain further insight.
Combining data from different data sources is a major advantage of a BI tool. It allows users to generate reports that would be impossible to create with any standalone tool. In this way, employees can find new solutions to old problems or solve new problems as they occur.
With ad-hoc reporting within a BI tool, users can also personalize the data that they want to see. An auto-generated report from an individual piece of business software usually can't be focused very narrowly. It'll always contain company or department-wide data. With a BI tool, users can narrow their reports to contain information that relates to them personally or their team.
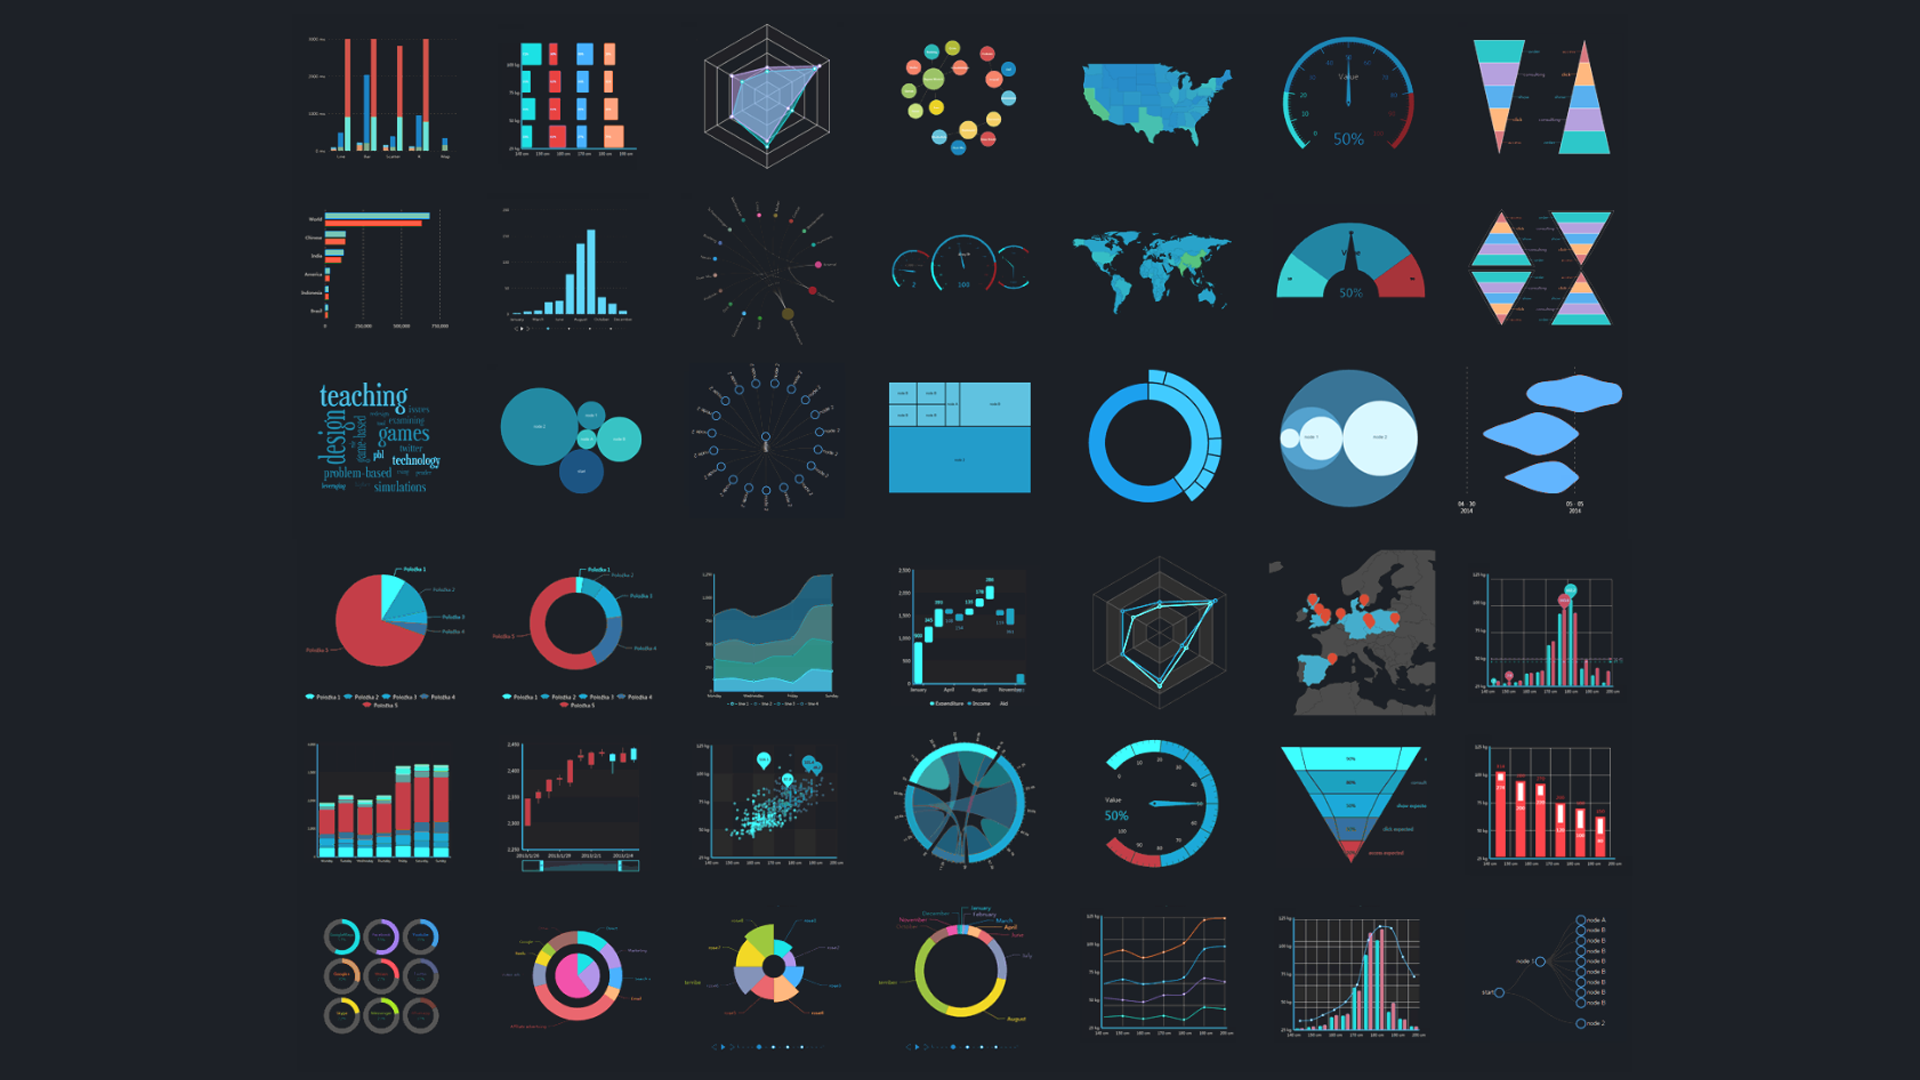
Building ad-hoc visualizations
Users can use the data contained in their ad-hoc reports to build out visualizations and dashboards. These visualizations can update dynamically as data updates or as new data sources are added to the data set. Users also don't generally need to do anything technical to build these visualizations; they just need to know how to use their BI tool's visualization features.
Using ad-hoc visualizations, users can see their data in a visual way. This makes it much easier to see trends and relationships, compared to viewing data in a spreadsheet or paper report.
One major advantage of ad-hoc analytics is its timeliness. With regular, generated reports, it might take an IT department a few days to figure out how to actually generate the report, plus some more time to build out visualizations from that data. By the time employees can actually view the visualizations, the data is often stale and out of date.
This slow reporting process also makes it impractical to build out reports and visualizations for projects and tasks that will only last a short time. Often, this means that organizations can only use data for big-picture, strategic work, and can't leverage their data in their day-to-day processes.
Ad-hoc analytics can fix all this. Since users can build out their own reports, they don't have to wait for IT to put something together. Their BI tool can automatically build out visualizations from this data, which removes that roadblock as well.
Since employees can move so much faster with ad-hoc analytics, it then becomes more practical to build out visualizations and dashboards for more short-term work. If the process to build a dashboard goes down from a week to an hour, it's much more cost-effective to build them for smaller projects and daily or weekly work.
Lastly, since ad-hoc visualizations update as the data that feeds them does, employees don't have to worry that their visualizations are out of date. Their visualizations are always fresh and effective, meaning that they can use them to guide their day-to-day work.
Ad-hoc Reporting: Making Data Work For You
Ad-hoc reporting is one of the most basic BI applications, but it's also one that has massive potential to transform how your business uses its data.
With the power of ad-hoc reporting, businesses can unlock their data. They're no longer limited by canned reports from their business software or their IT department. This allows businesses to view and use their data in completely new ways. Now, businesses really can leverage their data towards insight, instead of blindly following their reports.