Business in this day and age has become much easier to navigate with the advent of advanced Business Intelligence (BI). More and more managers and business owners are utilizing bespoke dashboards to monitor their business data and specific Key Performance Indicators (KPI’s).
What is a Business Dashboard?
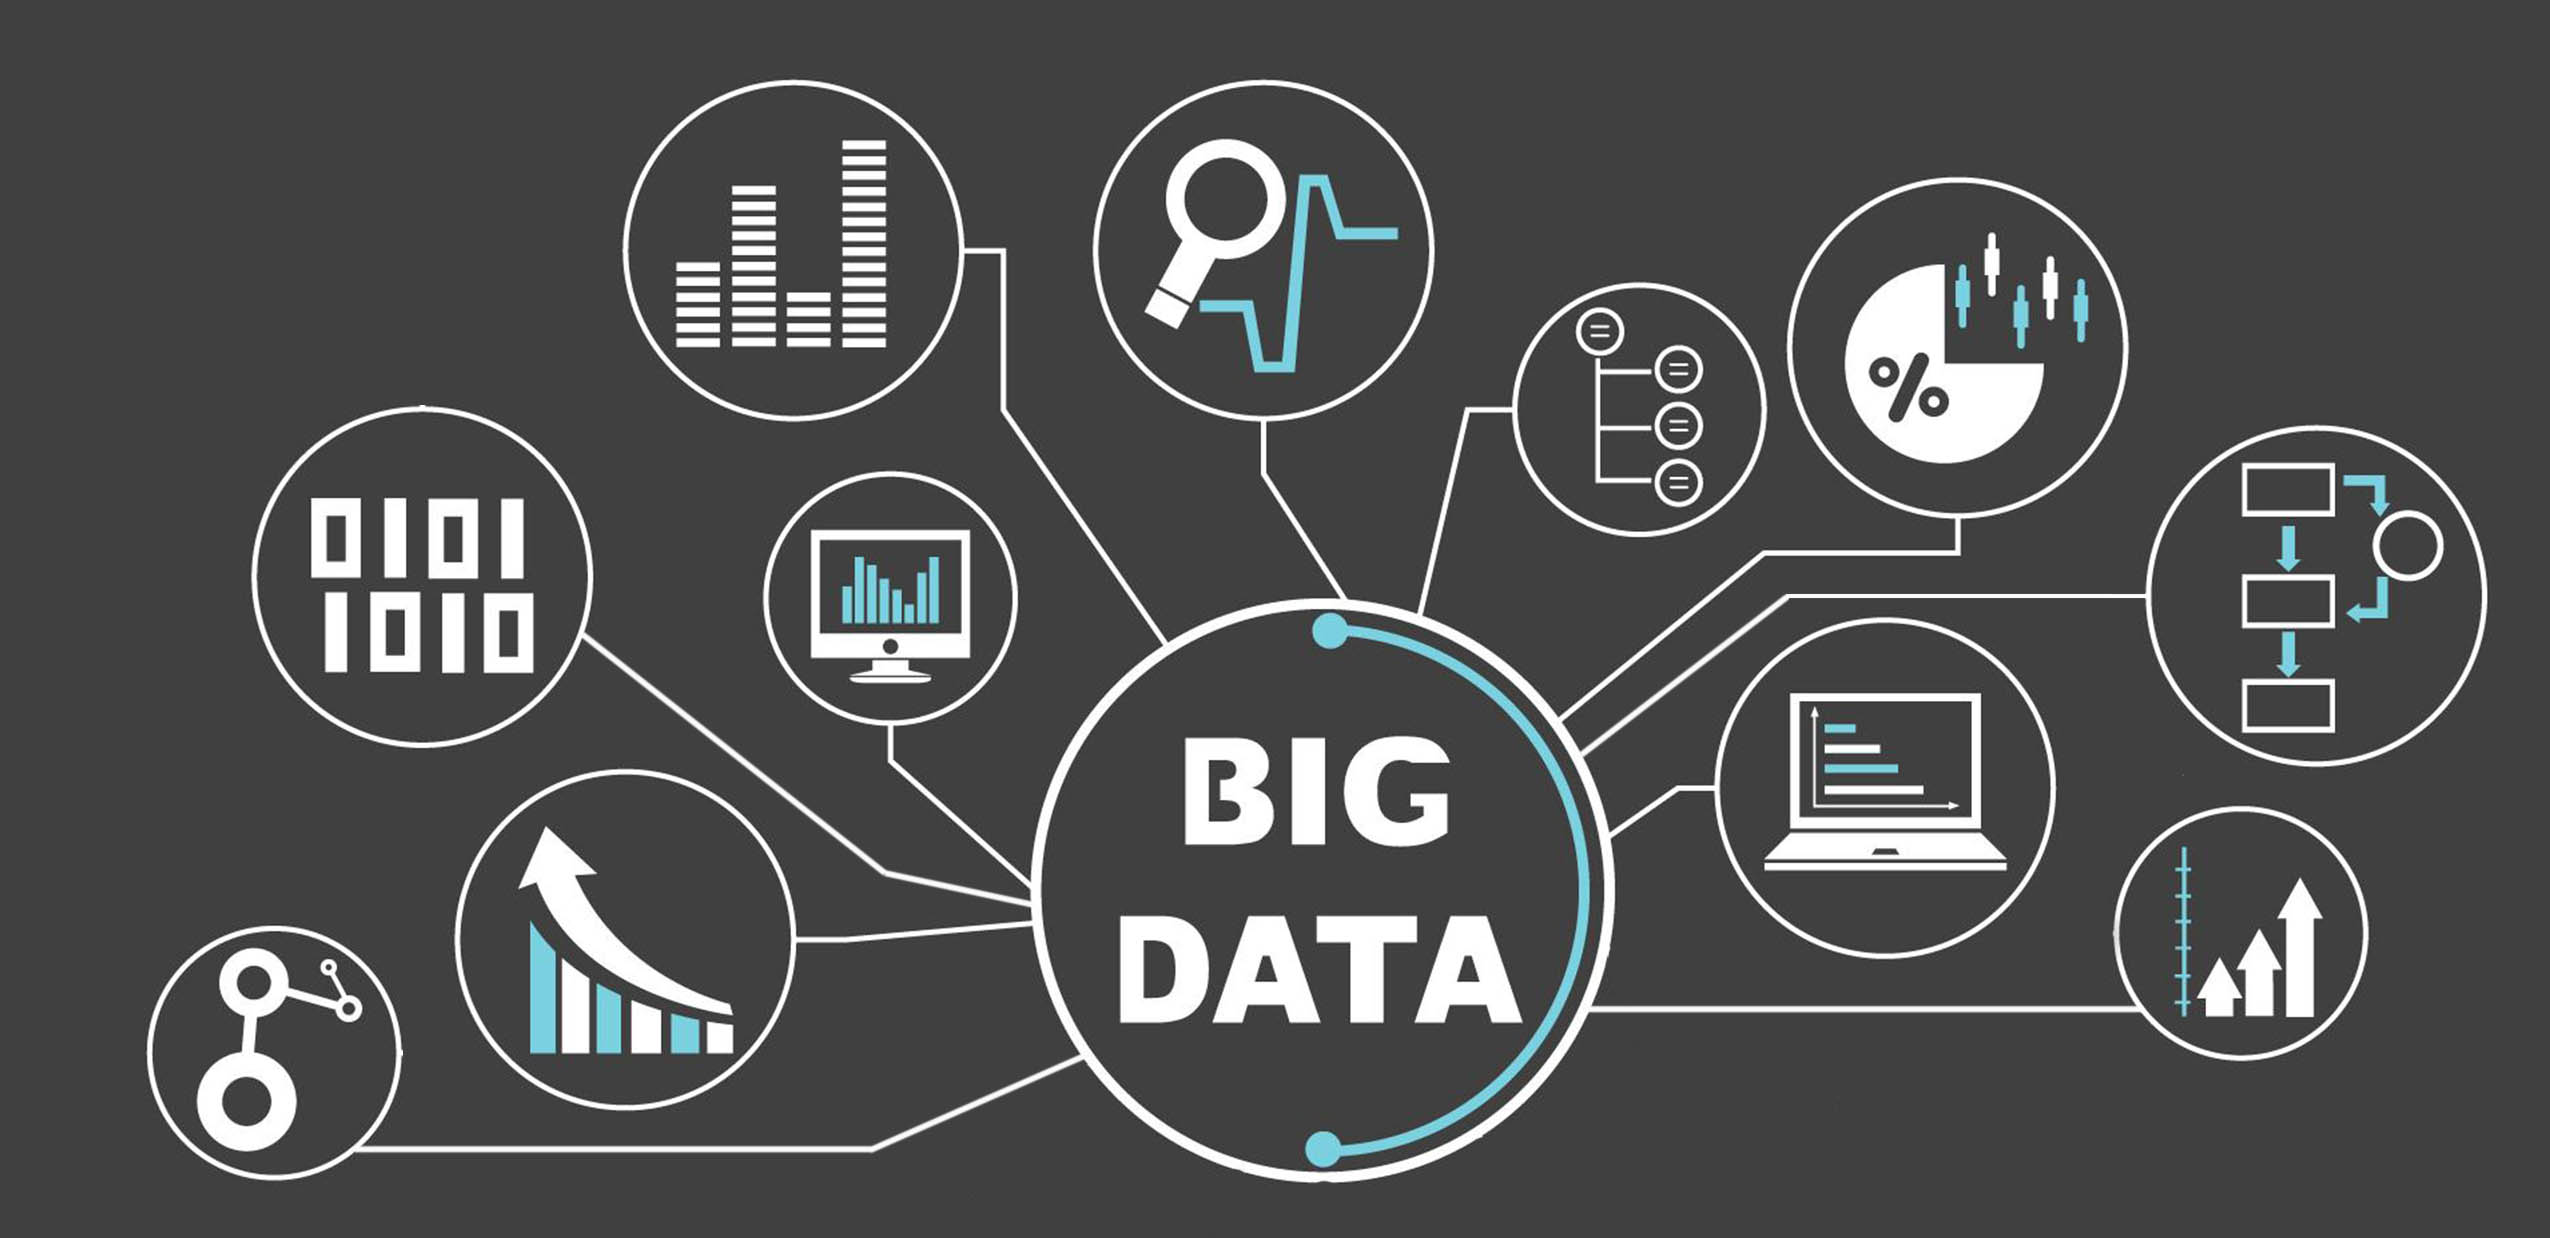
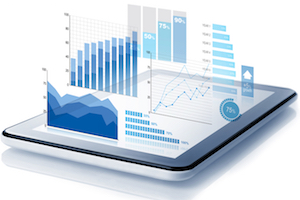
A Dashboard is a visual business resource that displays key business statistics in real-time; giving the user an overall picture of the ‘health’ of their business. Information is collated from various data sources such as Customer Record Management systems (CRM’s) or various other databases like e-mail or website data banks. It is then sorted and calculated to provide a top-line figure to demonstrate business performance against pre-defined objectives. These statistics, which previously would have taken many man-hours to collate and calculate can be
viewed at the touch of a button and allow the user to make informed decisions based on specific business intelligence.
What Can A Business Dashboard Tell Me About My Business?
You can gain a wealth of information with the right business Dashboard template. Here are some of the main benefits:
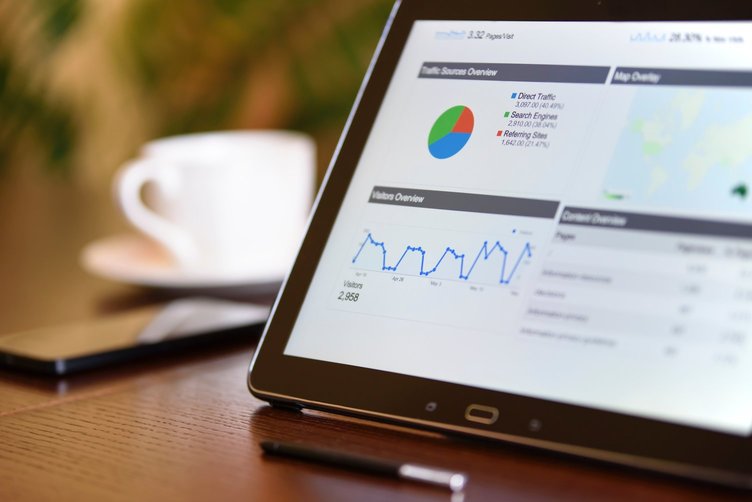
- Real-Time Visibility: You can see key data information at a glance in ‘real-time’, any time.
- Measure Performance: You can measure your business's performance against specific KPI’s and effect change accordingly.
- Time Effective: Removes the need for analyzing countless reports and data sources to extract the same information.
- Long and Short Term Goal Progress: An effective business Dashboard allows you to measure your performance not just against current KPI’s but against long and short term business goals.
- Identify Individual Performance Improvements: Your Dashboard can be tailored to identify not only departmental performance but that of individual employees aiding both employees
recognition and the restructuring of an individual KPI’s where areas of improvement are identified.
What To Look For In a Dashboard Template
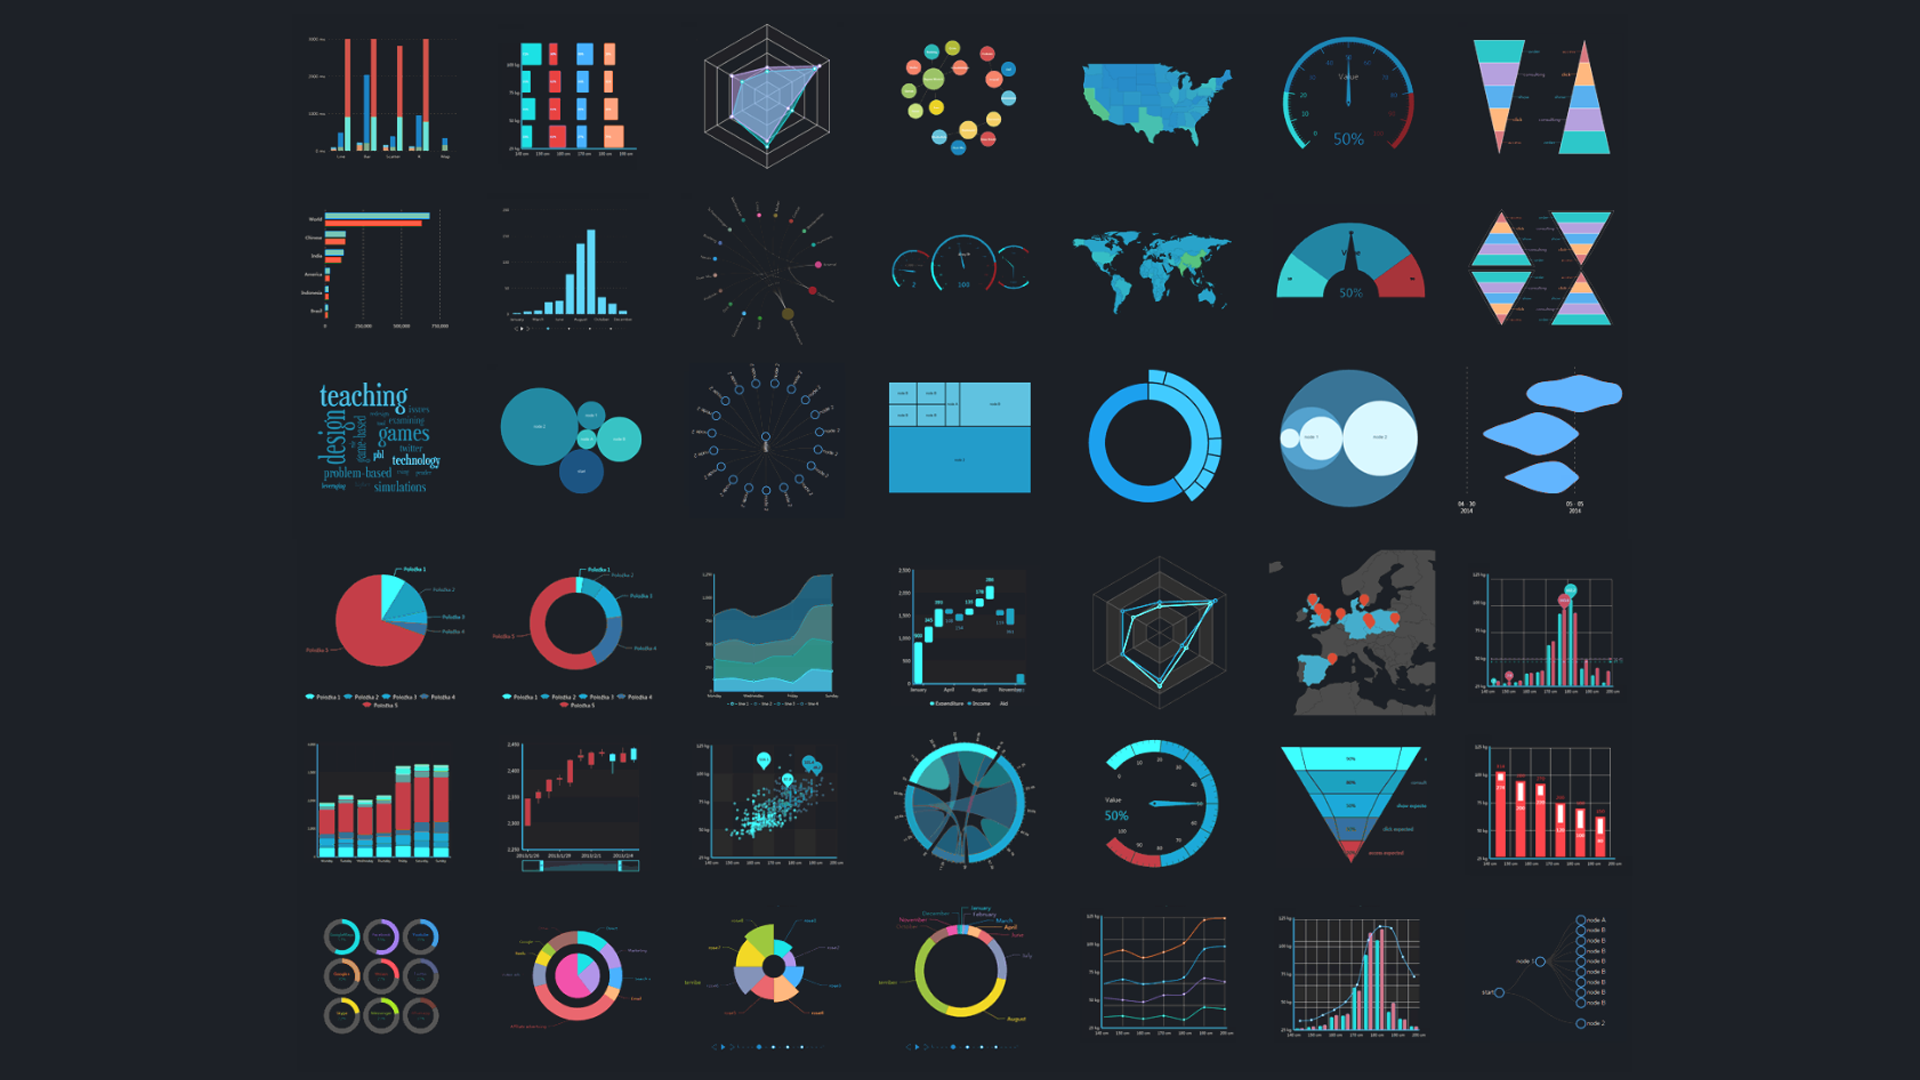
A Dashboard is ultimately a template to determine what statistics are to be viewed and in which format. Most Dashboard templates use visuals like line and bar graphs to demonstrate summarized statistics. Choosing which visual aids as well as which specific data to display are just two key decisions you will need to make when choosing the right dashboard template for your business.
Which Statistics?
Identifying the statistics you want your Dashboard to display is your first key decision when planning your Dashboard template. This is usually derived from what business questions you want answering, many of which will be associated with specific KPI’s. You might for example want to show your production statistics against a daily, weekly, or monthly KPI. If your goal is to produce 500 units of a specific product per day then you can program your Dashboard template to not only show your production in real-time but to measure it against your target KPI and against previous days, month, or even years production. In addition, it can project forward as to your overall anticipated production working at the same rate within one month or quarter. This type of information is invaluable as it allows you to adjust key business resources in a timely manner to ensure your targets are met or adjusted accordingly.
The same types of statistic can be applied to sales, marketing or even human resources and customer service. Your Dashboard template can display numerous summarized statistics at one time and as such can be used by business owners to view overall data or departments to view data that is specific only to them.
Data Importation
For your Dashboard template to correctly perform its function it will need to source data from various data banks within your business. Data can be input by employees for your dashboard to calculate summarized information from but this can be very time consuming and has a high risk of human error including the wrong data or old or incomplete data being added.
Ideally, your Dashboard data should be fed via an API (Application Programming Interface) which is programmed to work with your existing business systems. This will securely, automatically, and continuously connect with the correct data and reformat it was necessary to calculate real-time statistics against your business KPI’s and display them on your Dashboard Template.
Mobile Access
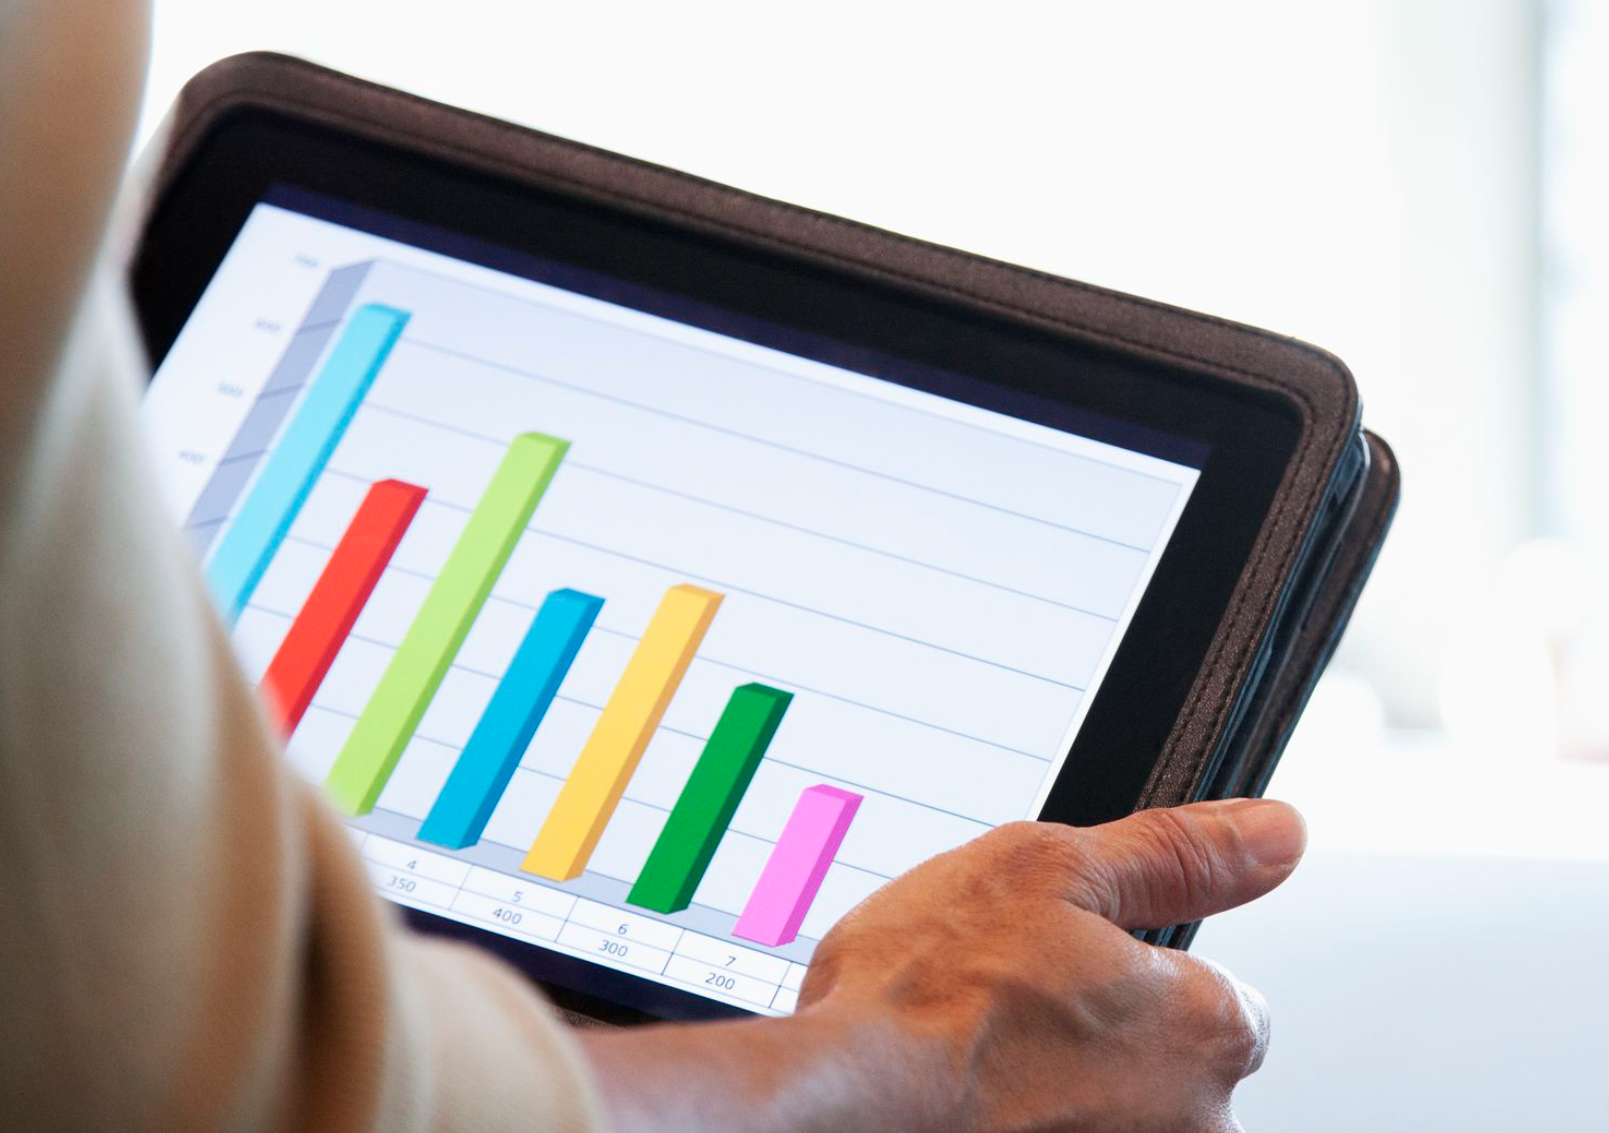
As more and more businesses are opting for remote or fragmented working, the Dashboard template you choose should be able to be accessed not only via computers in your internal business systems but through a secure cloud-based technology to enable access via mobile devices any time and in any geographical location.
Visual Impact
As there will be a variety of users on your Dashboard your template should reflect that and be clear and easy to understand as well as allowing ease of functionality. It is advisable not to overcrowd your template and wherever possible use visuals to demonstrate specific data. Icons are also a great idea instead of words. An up or down-pointing arrow will be universally recognized as an increase or decrease, the perfect space-saving option. Using combined graphs is also a great way to maximize space. For example, you could use a bar chart to show specific data ie. How many units are produced each day over a certain period and then, within the same visual media use a line graph to show the growth or decline comparison of those ‘actual’ statistics?
Systematic Display
An effective Dashboard should display statistical information in a systematic order so that users can understand each data set and how they relate to each other. This will also aid the ease of interpretation of reports produced from the Dashboard template viewed outside of the Dashboard itself.
User Training
Whilst the ideal Dashboard template should be self-explanatory to a certain extent, a professional business practice would be to provide user training and/or a user manual to assist with its use.
This should not only cover the statistics and what they mean but how these statistics can be used and interpreted within certain departmental and KPI structures. Many Dashboard templates give the option to vary data by using the certain drop-down or tick box methods to specify a certain time frame, user, or departmental statistic you wish to view. As such, knowledge of how to access this information and understand from which data this information is calculated will be invaluable to user ‘buy-in’ of your Dashboard template and its overall benefit to both the business as a whole and the individual user.
Which Dashboard Template?
Once you have considered all of the above you may wish to try and produce your own Dashboard based on ready-made templates that are available through various sources including the net. There is, despite what advertisers may say, no ‘one size fits all’ template as every business is unique. It is true that many businesses share similar KPI’s such as sales or productivity targets and growth but there will be many metrics that will be bespoke to your business. Just as you are the expert in your business, there are many experts in BI, especially in Dashboard template creation who can advise and guide you through not only the initial set up process but the ongoing use of your Dashboard and advanced options once the basics are in place. This is certainly an area of consideration when looking to implement a fully functional Dashboard template that will fit your business needs and serve any business expansion in the future.