Data analytics help businesses to make valuable choices. BI tools help businesses to access data analytics, so that they can use their data to drive insight. With a BI tool, they can unlock their data, spot trends, and find relationships.
However, not all analysis results in the same sorts of answers. Data analytics is complex, and it's very easy for new BI users to build dashboards and visualizations that aren't particularly useful.
Data analytics isn't only about asking questions and finding answers in data. It's also about knowing what sort of problems you're having, and knowing what sort of questions to ask to get solutions to those problems.
Often, businesses don't get the answers that they want out of the analytics that they're performing. This isn't necessarily because they're doing the analysis wrong, or because they're using the wrong visualizations. Usually, it's because businesses don't know how to ask the right questions to get the answers they want.
The difference between descriptive analytics and diagnostic analytics is one that trips up a lot of businesses. If businesses don't recognize the difference between these kinds of analytics, they'll end up with reports and visualizations that don't really answer the questions that they want answers to.
Many businesses don't even know there's a distinction between different types of analytics. They may not be able to realize there's even a problem with their data analytics that needs to be solved. With some additional knowledge about this topic, they can perform analytics that actually answer valuable business questions.
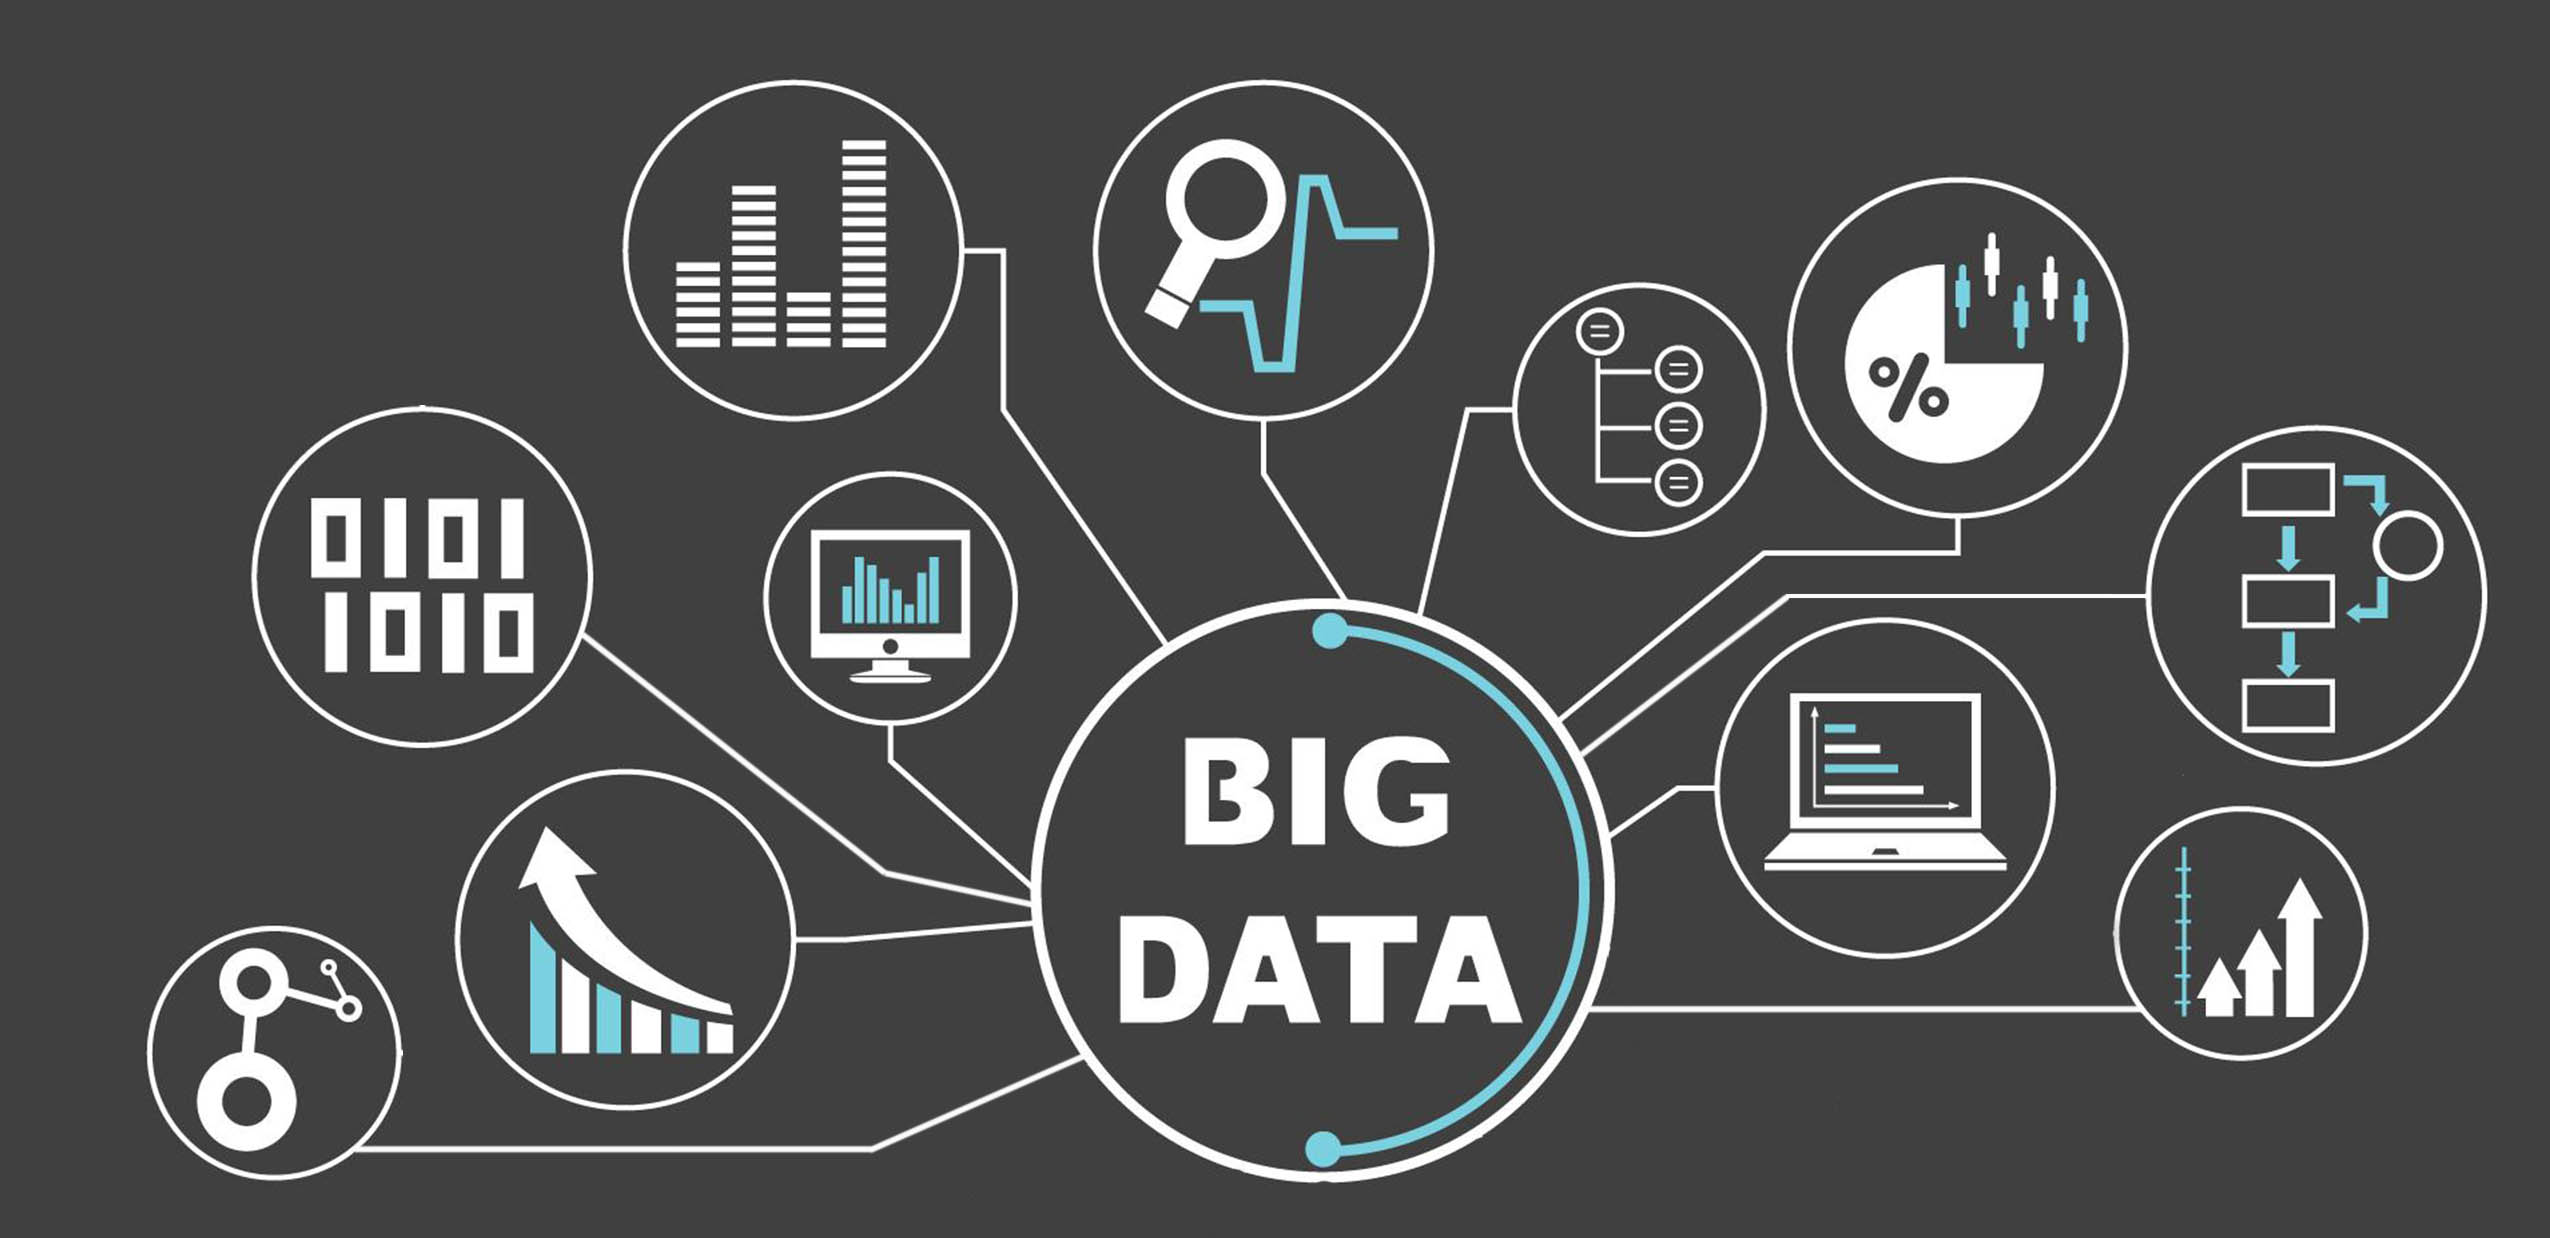
Types of analytics
There are actually four main types of data analytics. Each type answers a different kind of business question. Mostly, they're split up by how actionable the analysis is, and how much it recommends a clear course of action.
We won't go into detail about two of the main types, predictive and prescriptive analytics, right now. It's not that these types are unimportant; they're some of the most valuable analytics that a business can perform. They're just so complex that they're worth focusing other content on them. For more on predictive analytics, check out our guide on the topic.
Descriptive and diagnostic analytics are the most common forms of analytics that businesses that have a new BI system try to implement. They make up the bedrock of any business's BI strategy.
Descriptive analytics is usually the simplest kind of analytics. It shows trends and relationships between data, but it doesn't draw any conclusions about what a business should do about them. Many of a business's most basic reports and visualizations are descriptive.
Diagnostic analytics take descriptive analytics one step further. It attempts to find the root causes of problems by finding correlations between data. It's a much better tool for finding answers to complex business questions than descriptive analytics, since it recommends a clear plan of action that a business can follow.
In short, descriptive analytics tell a business what's happening, while diagnostic analytics show businesses strategies for solving specific business problems. They both have their own strengths and weaknesses and often, visualizations using one type of analytics might be better served with the other type.
For example, a graph that shows how revenue is trending over time is a fairly simple descriptive analytic that many businesses use. It's useful for telling viewers what's happening with the business's revenue, but it doesn't offer any insight into what to do if it goes down.
On the other hand, a pie chart that shows revenue by product might be more useful as a diagnostic analytic. It can show users exactly where the business is making its money, and a viewer can draw insight from the graph on where to focus their efforts to boost revenue.
Descriptive analytics
Descriptive analytics tend to make up the core of most business's analytical strategy. They're usually very easy to implement, and they're the easiest sort of visualization for the average person to understand. Since they're so simple, many businesses use a ton of descriptive analytics in most of their dashboards.
These sorts of analytics are best at answering simple, common business questions. They often answer questions that start with 'what', 'who', or 'where'. These sort of questions are simple to answer, but are important for tracking business health.
Monitoring business health is just as important a function of a BI tool as solving complex business problems. Just because these questions are less complex than ones solved by other analytics doesn't mean they're any less useful.
Descriptive analytics are very important for building alerts and notifications. While users can build alerts off of other analytics easy enough, descriptive analytics generally are the best fit for these sorts of use cases. Since they're actively monitoring important business metrics, they're the best early warning system for issues.
Other analytics may excel at telling users how to solve issues, but descriptive analytics are the best at telling users when problems are happening. They're how businesses know that there are problems that need solving. Actually solving the problem is a task better left to diagnostic analytics.
There's an almost endless list of use cases for descriptive analytics. Any situation where someone needs to track a metric is a good fit. If your question is some variation of 'What's happening?', then descriptive analytics will provide the best answers.
Diagnostic Analytics
Diagnostic analytics are the analytics that actually suggest a path forward. They're reports and visualizations that try to accurately find the causes of business problems, so that users can plan solutions to them.
Some people think that a BI tool is going to tell them what they should be doing in big clear letters. Diagnostic analytics are rarely that specific. Usually, they just provide some important pieces of information and let the user draw their own conclusions on what to do.
Often, diagnostic analytics come in the form of a regression analysis. This is the classic 'when this line goes up, this line goes down' type of graph that users have probably been using since grade school. These sorts of graphs are a useful way to see the relationship between two variables.
Diagnostic analysis determines if there's any causal relationship between two variables that move in concert, and if there is, to what degree the two variables are related. This analysis helps businesses to see the solutions to their problems.
For example, if a business knows through diagnostic analysis that their lead generation is related to the number of deals that convert, then they can use that information to decide on their best course of action. There isn't some big visualization that says 'boost your lead generation or go bankrupt', just an analysis that shows a lever that the business can pull.
Sometimes diagnostic analytics can end up looking more like descriptive analytics. In these cases, there's less active analysis going on. The BI tool just presents the information, and lets users figure out the best sort of action.
Using both types of analytics
Businesses that want to properly leverage data analytics need to know the difference between descriptive and diagnostic analytics. They need to know when to use both types, and what sort of questions are best answered by them.
A good dashboard should have both types of visualization on it, not just one. Since both types answer different types of questions, a dashboard that's aiming for a comprehensive view of a topic should have both types.
One common perception is that descriptive analytics are less useful than diagnostic analytics, since descriptive analytics answer simpler kinds of questions and don't suggest a clear path forward. However, both types have their uses, and it's a mistake to only use one type at the exclusion of the other.
Descriptive analytics show businesses where problems are occuring, and diagnostic analytics present some solutions to those problems. A business can't effectively solve their problems without diagnostic analytics, but they're completely blind to new problems if they aren't using descriptive analytics.
Along with the other two types of analytics, descriptive and diagnostic analytics make up the core of a business's data solution. With a better understanding of the types of analytics, businesses can ask the right questions and get valuable answers.