In the following, we look at the top-ten features your business should be looking for in its dashboard and reporting software, while outlining four others which we also consider to be important. Before we go there, however, we will take in a brief look at where business intelligence (BI) is currently and consider what that means for your business.
BI’s Primary and Evolving Applications
One of the first and primary applications of BI in a company or organization is likely to be in the area of reporting through the basic collation of its existing data streams. Sales reports are probably a key area of use, while deeper analysis may consider demographics and geographic data. The next phase and use of the data could be to match the generated reports with predicted targets, such as sales or financial forecasts. By applying such raw data to the “state” of the business, decisions can be made based on both real-time information and forecasted outcomes.
As the way organizations handle their data has evolved, it has become more user-friendly. This has involved the passing of data handling from the hallowed domain of the technically proficient, directly into the hands of those who are best able to make use of it. This so-called “self-service” BI has played a huge role in opening up the use of data to teams and individuals at the leading edge of the daily operations of businesses.
Now, end-users are less interested in understanding SQL and more concerned with using the data such methods create, hold, and analyze. This has virtually removed a whole layer of data
management which was once needed to translate it into an understandable and usable format. Better still, business owners now benefit from the huge cost savings that this data collection
revolution has enabled. The good news is that the technical prowess which was once applied to the basic uses of this technology for simple data collection is now being turned to creating dashboards and data modeling. In effect, the managers and end-users of today’s data mountains enjoy the ease of access to information which allows them to make decisions based on immediate and real-time insights.
Looking at 10 dashboard and reporting software must-haves
1 - Visualizing through data connectivity: Before you get anywhere near visualizing your data it has to be accessed and that calls for systems that are able to connect with it. In the not too distant past, the weapon of choice would have been a specific API (Application Programming Interface) which would also have necessitated the services of a programmer and his entourage. The advent of cloud-based systems and neatly packaged software systems, has, however, driven these aforementioned approaches to the brink of extinction. The moral of the story being, that your organization will be in a much better place in relation to retrieving and handling its data sources when it chooses to invest in an in-house (native) system. In short, having a native BI platform that allows access without coding and language skills is likely to be your number one priority.
2 – The importance of efficient data management: Considering your need to have all of your data available in one holding zone, data warehouse or other platform is something of a given, your next task is going to be ensuring that the connecting systems are able to “talk” to each other. How your system (or systems) manages the data you accumulate is crucial to the quality of your end results. To this end, native systems that provide checks and balances against faulty data inputs (usually human error) are likely to be a highly important consideration.
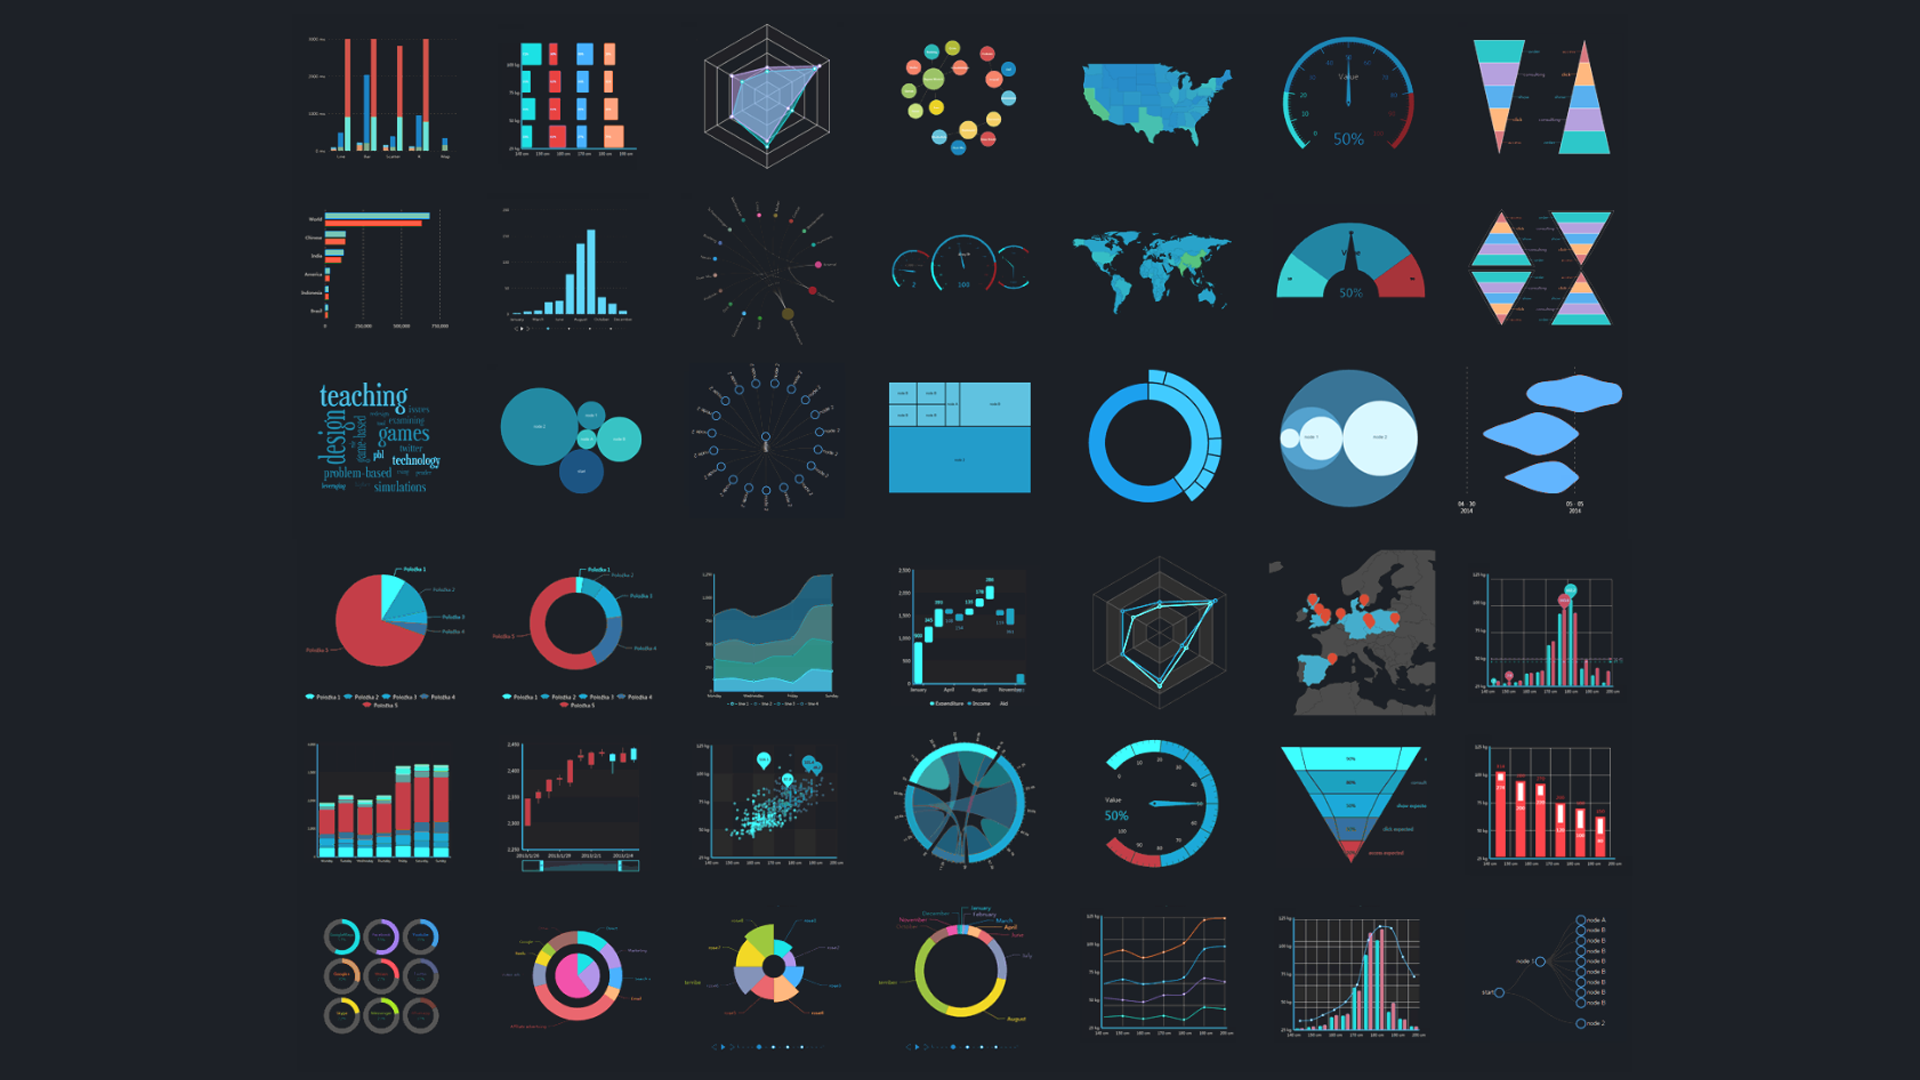
3 – Data visualizations which work: Considering that we have not yet reached the point where we can allow our BI, machine learning and AI to actually action the decisions we make based on our data findings, we still need to consider the human factor. While much emphasis is often placed on the negative impacts of faulty human input of data, the upside is that we are still the masters whom such data serves. The upshot of this being, that eye-catching graphics and easy to interpret dashboards really are a key factor in enhancing how data is processed and applied by its human end users.
4 – Utilizing the huge possibilities of access and publication: Although there is still a hardcore group of fanatics who believe that the earth is, in fact, flat, it should be sincerely hoped that very few of their number are employed in the data-handling sector. In short, cutting edge BI within data publication need not be restrained by static office software such as PDF PowerPoint and others. Rather, modern systems allow users to share data in all of its dynamic glory as webpages and other flexible formats that can facilitate deeply embedded filtering and exporting options. These features can then be accessed by anyone on the team, wherever they are, on virtually any device.
5 – Automation: If you are either a glutton for punishment or take delight in wasting your company’s valuable man-hours, you are likely to have more than just a passing interest in the use of automation. It is a somewhat sad and unfortunate fact of business life that there are those who take some misplaced satisfaction and a sense of achievement from slavishly compiling miles of Excel charts. However, customers, colleagues, and of course, the business itself is likely to benefit from the more responsible approach which automation provides.
6 – Remembering the importance of hardware: While the days of the in-house server (for small businesses at least) may be somewhat numbered, access to cloud storage and data handling hasn’t completely done away with the need for some hardware. Our increasing reliance on remote data warehouses and other cloud facilities does carry with it, the very real danger that we can slip into taking our hardware somewhat for granted. The bottom line is that your desktops, laptops, and mobile devices still need to be considered and factored into your overall data handling strategy. From compatibility and durability to obsolescence and security, the hardware is still a major consideration. Ascertaining that your dashboard solution and BI platforms don’t need software installation is also an important consideration. Considering licenses for your operating systems and devices should also be something you might want to bear in mind when planning your long-term data handling and BI strategies.
7 - The importance of being mobile: Naturally leading on from hardware is likely to be some obvious questions about how your reporting software integrates with mobile devices. While the excessive (if not even addictive) use of mobile devices has received some bad press in recent years, there may be benefits in encouraging its more positive uses. Consider, for example, the motivational benefits of being able to see the immediate results of sales and strategies out in the field. There is little doubt that better mobile integration including easy to use and access data dashboards have the potential to create better user habits and behaviors. While accessing desk-based applications is likely to be viewed as a job function, browsing our smartphones has become something of an almost unconscious habit.
8 – The benefits of integrated user security: Just like electricity, humans are likely to choose the path of least resistance and that includes how we access our data. By utilizing the ease of access to your BI platforms and other dashboards you are more likely to encourage visits from your teams. Integrated security which allows access across programs and functions is one easy way to stimulate increased user interest. SSO (single sign-on) offers users the ability to sign in once and then access a whole range of applications and functions without needing further passwords and user details. With only one set of credentials to manage, it makes it easier to use while also reducing the number of lost/forgotten password instances which your IT teams will have to deal with.
9 – Utilizing alerts: Something of a two-way street, alerts will work for you and your personnel by alerting them to crucial information while also feeding back their responses to those who need to be aware of them. From conventional email and text alerts to integrated dashboard responses, the possibilities of how alerts can be used are virtually limitless. While BI systems have not yet reached the point where they will think for your employees, they can do the next best thing, which is to remind them to do it themselves.
10 – Appreciating the beauty of embedded analytics: The idea of embedding the function of one system into another is nothing new. However, combined with the latest evolving technologies, it is being catapulted to the forefront of business intelligence. One thing that everyone appreciates about the mountains of data which we now live with is that they are highly portable. From accounting and ERM to CRM and inventory control, almost every system now has the ability to integrate with others. Using embedded analytics within a system provides data analytics “on tap” without the need to instigate separate data models. Thanks to the ongoing huge strides in device capabilities, these embedded analytics can also be utilized from virtually any location by any authorized user.
Where to next with business intelligence?
If your head isn’t already reeling, the exciting news is that BI and reporting software still has plenty left in the bag as far as ongoing and future development is concerned. While much of this article has explored what may be considered as current applications, AI looks set to herald in the next exciting phase. The advent of such things as machine learning, predictive analytics, and advanced analytics are set to make our data move both faster and further than ever before. These enhanced functions will offer such things as:
1 – Intelligent cleansing and monitoring of data: Through AI-enabled machine learning, there is the potential for BI platforms to detect anomalies and alert users to them. Evolving and learning algorithms could, in effect, remember events and responses, matching them up to both present and projected outcomes. Considering the sheer volumes and variables which are available to such systems via the Data Mountains which they access, it follows that a virtually limitless supply of data would be available from which to process such scenarios.
2 – Narratives and storyboards in data use: Through the increased power made available by the latest generation of BI and reporting software systems, “pure voice” communication with such systems is already in everyday use. Because one of the key aspects of these ongoing developments is how existing and evolving technologies are being combined, it is envisaged that the speed at which these systems operate will increase exponentially. From language generation to real-time video editing, the next few years are likely to see even greater leaps in the use of such systems.
3 – The importance of image: The old saying about having to know where you came from before you discover where you are headed could easily be applied to data. With data now moving at ever-increasing speeds between multiple systems, it is highly likely to be “changed” by the systems it passes through to some degree or another. Developing systems that have the ability to query the origins and journey of data are therefore likely to become a prominent part of BI within reporting software systems.
4 – The imminent advent of predictive analytics: While forecasting using data analytics is nothing new, AI within business intelligence is likely to take the concept to the next heady level.
Although the increased speeds at which data modeling will take place are likely to play a role in this, the main advances will be made through the use of AI-driven “learning algorithms” which will adapt and change with respect to what they learn from the data over time.