This may seem hard to believe given our current preoccupation with Big Data, but few organizations make effective use of the little data they need to make management decisions and improve performance. Organizations of all types need to pay attention to three types of data: customer demand, work status, and performance outcomes. This post provides an overview for all three types and focuses on demand data. I'll cover work status and performance data in greater detail in future posts.
Demand data
Demand data reflects the volume of incoming work to an organization, business unit, or work team and is expressed as a quantity per unit of time: 50 customers an hour, 700 orders a week, 7 new projects a month, 15,000 items per hour, and so on. Understanding demand is critical for designing work systems that meet demand while simultaneously reducing burden on people and equipment. Yet it’s shockingly common for organizations to lack such fundamental information.
Understanding internal and external customer demand requires organizations to track volume from all sources of incoming work. To ensure the data is accurate, organizations need to scrub it to eliminate duplicates and confirm that the numbers reflect the full picture.
In our work with clients, incomplete and inaccurate demand data is a particularly common finding. For example, a defense contractor was struggling with growing work queues in its I.T. division and was losing out on six-figure annual performance bonuses. Leaders believed their teams received an average of 18,000 I.T. service requests every month based on data from the customer service call center, and they relied on that number to determine staffing and equipment budgets. When the numbers didn't add up and we pushed for a deeper look, the improvement team discovered three other sources of incoming I.T. service requests. Once they removed duplicates, the average monthly demand was 33,000 tickets—nearly double the volume the current process was designed to handle.
Understanding demand patterns and trends over time is equally vital for providing customer value. Organizations often believe there are no discernible patterns in demand variation, but when we look at data over longer time horizons, predictable patterns often emerge.
A case in point: while working with a hospital emergency department (ED) to reduce patient throughput times, we probed the leadership team about incoming demand. The ED Director said it was impossible to predict hourly and daily volumes. As a result, they relied on on-call staff, a staffing model that typically causes delays in work flow and places undue stress on team members.
When we collected and analyzed incoming patient volume over a two-year period, a distinct and consistent pattern emerged. Identifying trends and patterns not only helped leaders understand and plan for incoming work volume, it also showed that the presumed beginning of their peak demand period—1:00 pm—had shifted over time to 10:00 am. Leaders were relying on old data to make important operational decisions. Accurate demand data is essential for designing high-performing work systems.
Status data
Status data reflects progress on work-in-process. Clarity about how work is progressing from a request to delivering on a request enables organizations to remove obstacles that stand in the way of meeting commitments to customers, both internal and external. Status data also allows teams to make real-time decisions about growing or shrinking capacity. Examples of status data are: six of seven production lines are operational; we’re in the second phase of the mining project; we’ve had seven no-shows so far; we’ve received 320 out of 350 expected orders.
Status data enables an organization to be proactive. It lets manufacturing leaders, for example, see when a production line is behind schedule so they can take steps to get back on track. It lets service sector teams know when they are at risk of missing a major customer commitment. Relevant, accurate, real-time status data allows organizations to solve problems while they are still manageable, and avoids the need for heroics after a manageable situation has deteriorated into a full-blown crisis.
Performance data
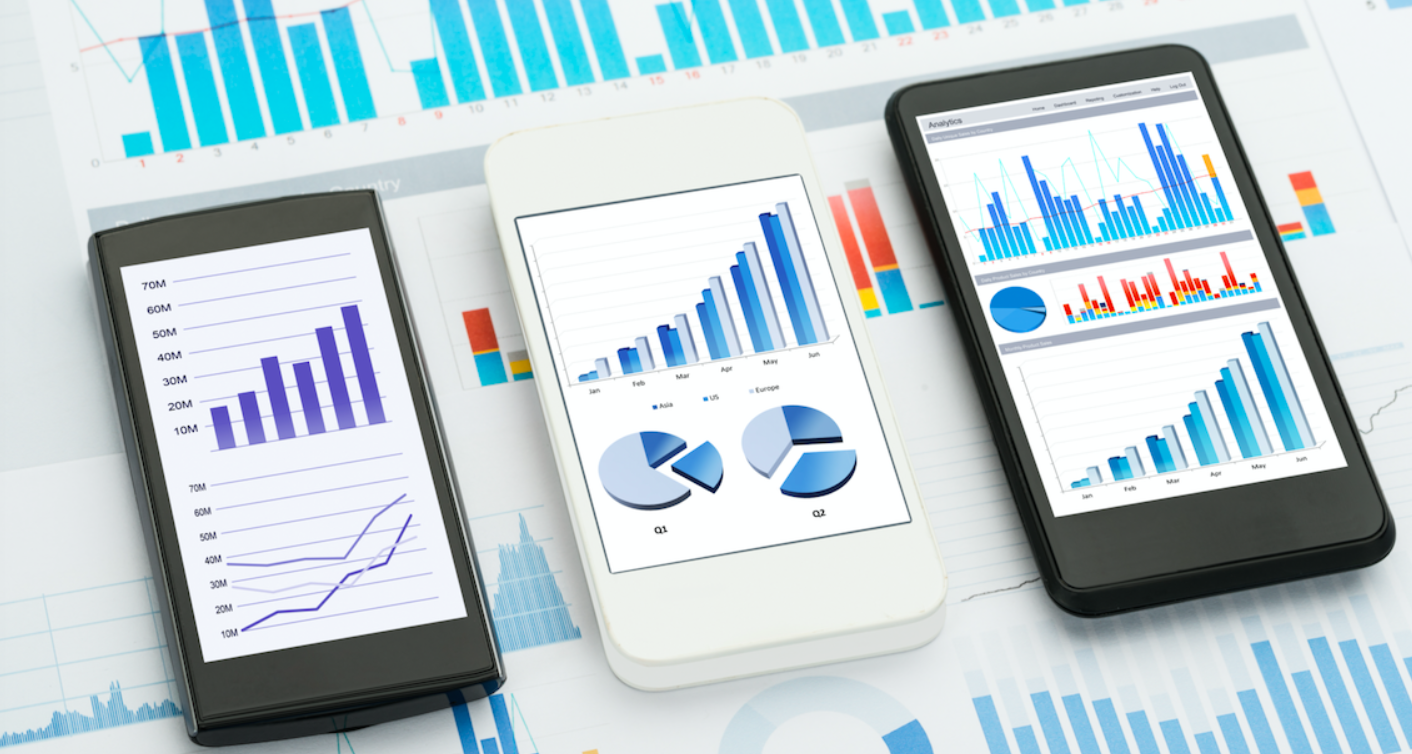
Performance data reflects performance outcomes over time and, ideally, against a target. It’s best tracked on a line (run) chart, on which the horizontal axis reflects a time period (e.g., hours, day, week, months) and the vertical axis reflects the measurement (quality, sales, turnover, returns, safety incidents, and so on).
People often confuse outcome data with status data, but they’re not the same thing. Outcome data reflects results versus the progress made on work. Outcome data for a training program, for example, should reflect how well participants perform new tasks versus the percentage of a team that received the training.
An organization can rely on simple demand, status, and outcome metrics to make better and more timely management decisions, or use more sophisticated analyses depending on the industry and type of work. But whether simple or sophisticated, leaders should know at a glance how well their teams are doing relative to all three measures: the volume of incoming work, status of the progress on that work, and how well the work is being performed against defined targets. Without it, how does anyone know how the organization is doing relative to where it wants to or needs to go? To gain the insights needed to truly improve business performance, organizations need to nail little data before they set their sights on Big Data.
This article first appeared on Forbes and was written by Karen Martin and can be found here.