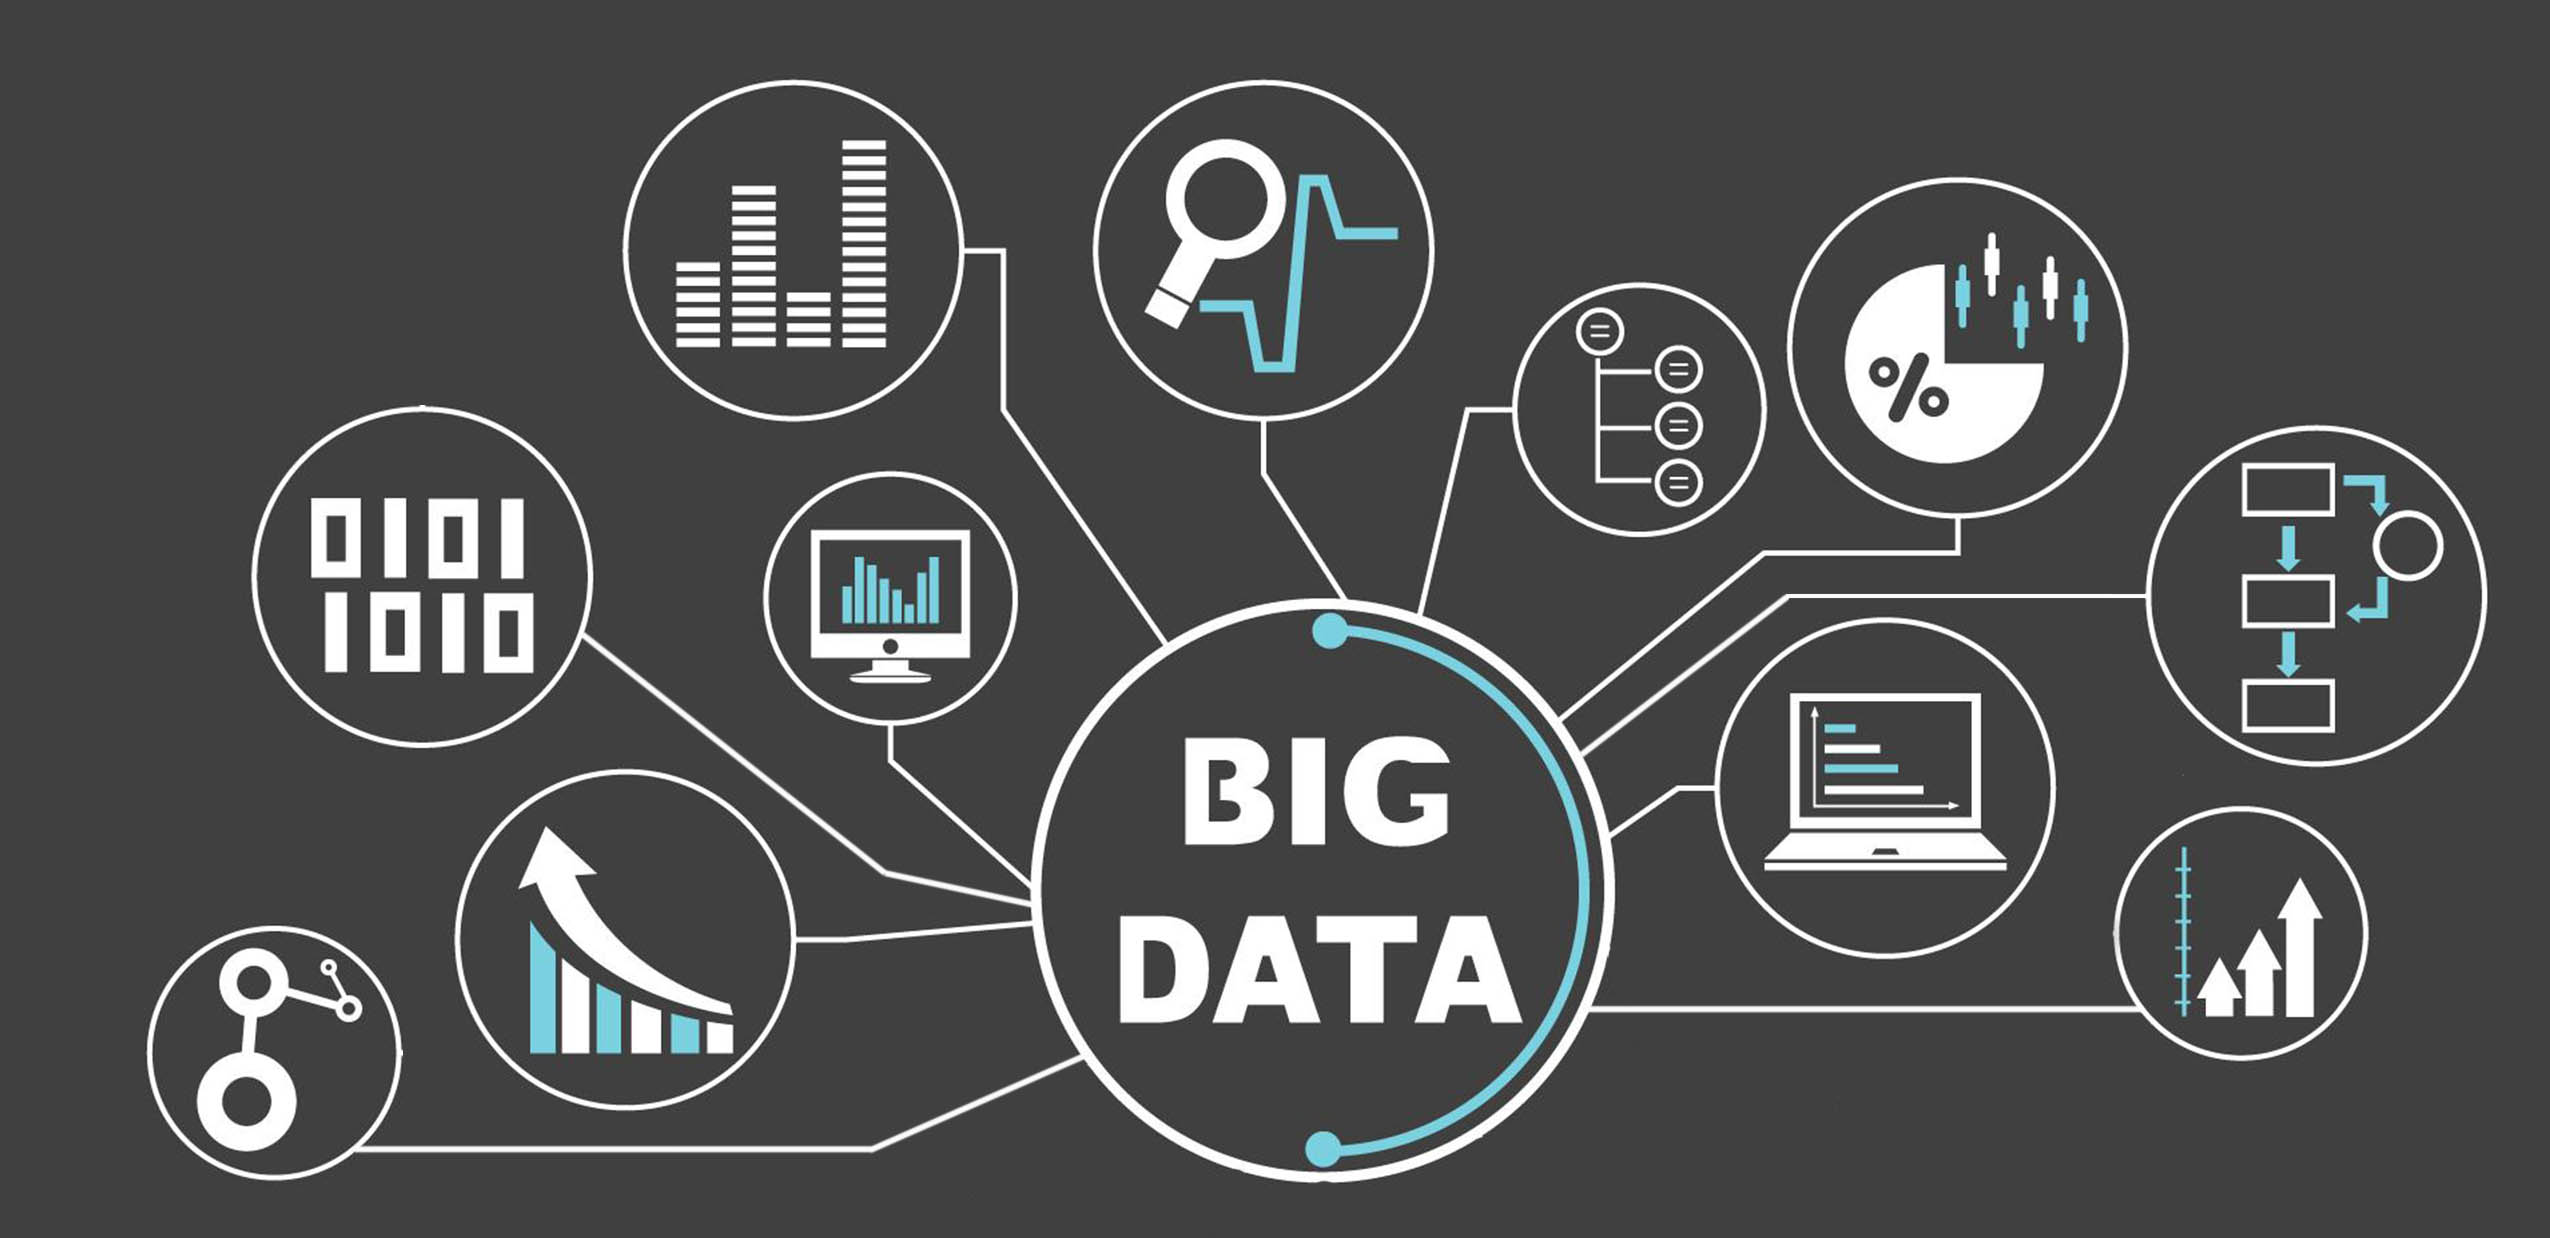
In the fast paced, technology driven business world we now live in, business information and data has never been so easy to identify, store, access and analyse. Metrics we would have previously not had access to or that would have taken hundreds of man hours to identify or quantify can now be accessed at the touch of a button thanks to modern technology. This advanced technology or BI (Business Intelligence) gives today’s business owners and managers access to specific data relating to their business or departmental ‘health’ at any given point and offers the opportunity to set targeted KPI’s (Key Performance Indicators) to drive future growth and profitability.
What are Analytics/Data Dashboards?
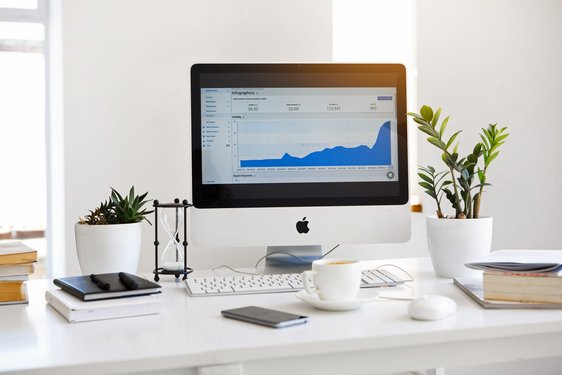
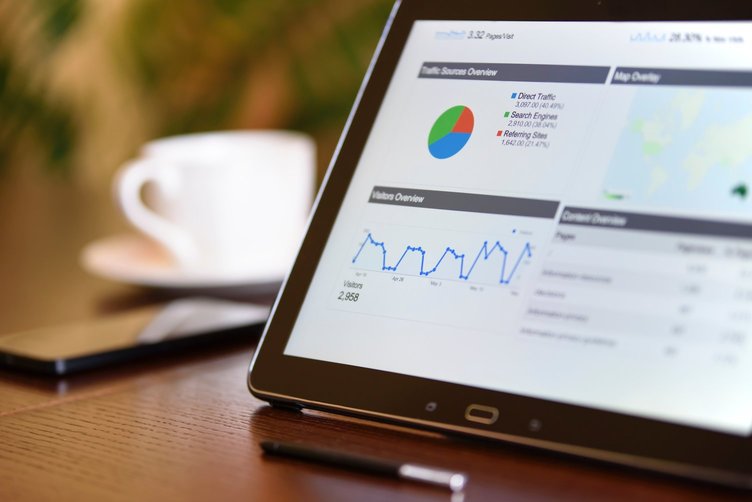
The dashboard itself is a screen that displays multiple data and metrics using charts and other visual aids to summarize key business information. This data is sourced from your business files, services, and attachments. This is all possible from specific computer programming through an application programming interface (API).
What Can A Business Analytics Dashboard Tell Me About My Business?
The summarized information that an Analytics or Data Dashboard provides is dependent on the department or specific aspects of the business you wish to monitor. Dashboards are developed based on targeted questions relating to the type of insight a business wishes to yield. Ultimately, a data or analytics dashboard should provide real time, easy to read, summarized information which alerts you to areas of the business where you need to make key changes to your strategy and KPI’s. Alternatively, it may simply confirm that your business is delivering consistent results against the KPI’s already in place.
Analytics Dashboards for Call Centers
A call center can provide a huge amount of data relating to the overall performance of a business. This could incorporate sales and customer service and help identify where processes are or are not cost effective. It can also provide valuable information that can be used by other departments in their overall strategy. For example, if it is statistically proven that all customer service inquiries are answered within a maximum one minute waiting period and this has been monitored over an adequate time period, then this is a positive statistic which marketing and sales departments can use to re-enforce the service of the company to potential clients.
In a call center environment for example you may want to ask questions of your dashboard like:
- What are the average number of outgoing sales calls per hour?
- What is our sales call conversion rate?
- What is the average duration of an outgoing sales call?
- What is the average waiting time for an incoming customer service call?
Analytics Dashboards for Sales
Knowing key information about the products or services that you are selling in your company allows sales executives and business owners the opportunity to identify trends in product sales, sharp declines and progress against any other day, week, month or year.
In the sales department of your business you may want to ask questions from your dashboard like:
- What is our best selling product per annul/this month vs last month?
- Which product has generated the most profit vs units sold this month, week or annul?
- What product has declined the most in sales this month vs last month?
- What is our year to date sales figure vs the same time last year?
Analytics Dashboards for Marketing
As marketing covers such a broad spectrum of resources including social media, e-mail marketing, print marketing, website and SEO there is so much valuable information that can be gleaned through a marketing specific dashboard. Some questions that might be asked are:
- What is our website landing page conversion rate?
- What is our e-mail marketing conversion rate?
- What is our social engagement across all our social media this month?
- Which link across our social media gained the most traffic to our website?
Executive Analytic Dashboards
An analytics dashboard can be tailored to any aspect of a business with specific KPI’s to summarize. These can even be applied in IT, Accounting, and Human Resource departments.
Business Owners or Management Executives, however, will require their dashboard to summarize the top line KPI’s of all departments giving them a view of the efficiency and profitability of the business as a whole. Statistics will relate to financial analytics verses time and efficiency analytics.
This data will aid business owners and senior management to make core changes based on hard facts that are accessible in real time. Data that was previously not available, rendering decision makers effectively blind when making core business decisions that effect their long term sustainability and growth.
What should I look for in an Analytic Dashboards?
Most business people never understand the true value and flexibility of an analytics dashboard until they have experienced the wealth of information it can provide and the certainty it gives when making key business decisions. However, there are other core considerations to ensure you choose an effective dashboard that is suited to your specific business needs:
- Analytic Dashboards That Can Be Specifically Targeted – Ensure that any department can tailor their dashboard to specific data and analytics based on the questions they wish to answer and that the dashboard can collate that information effectively from their existing systems and resources.
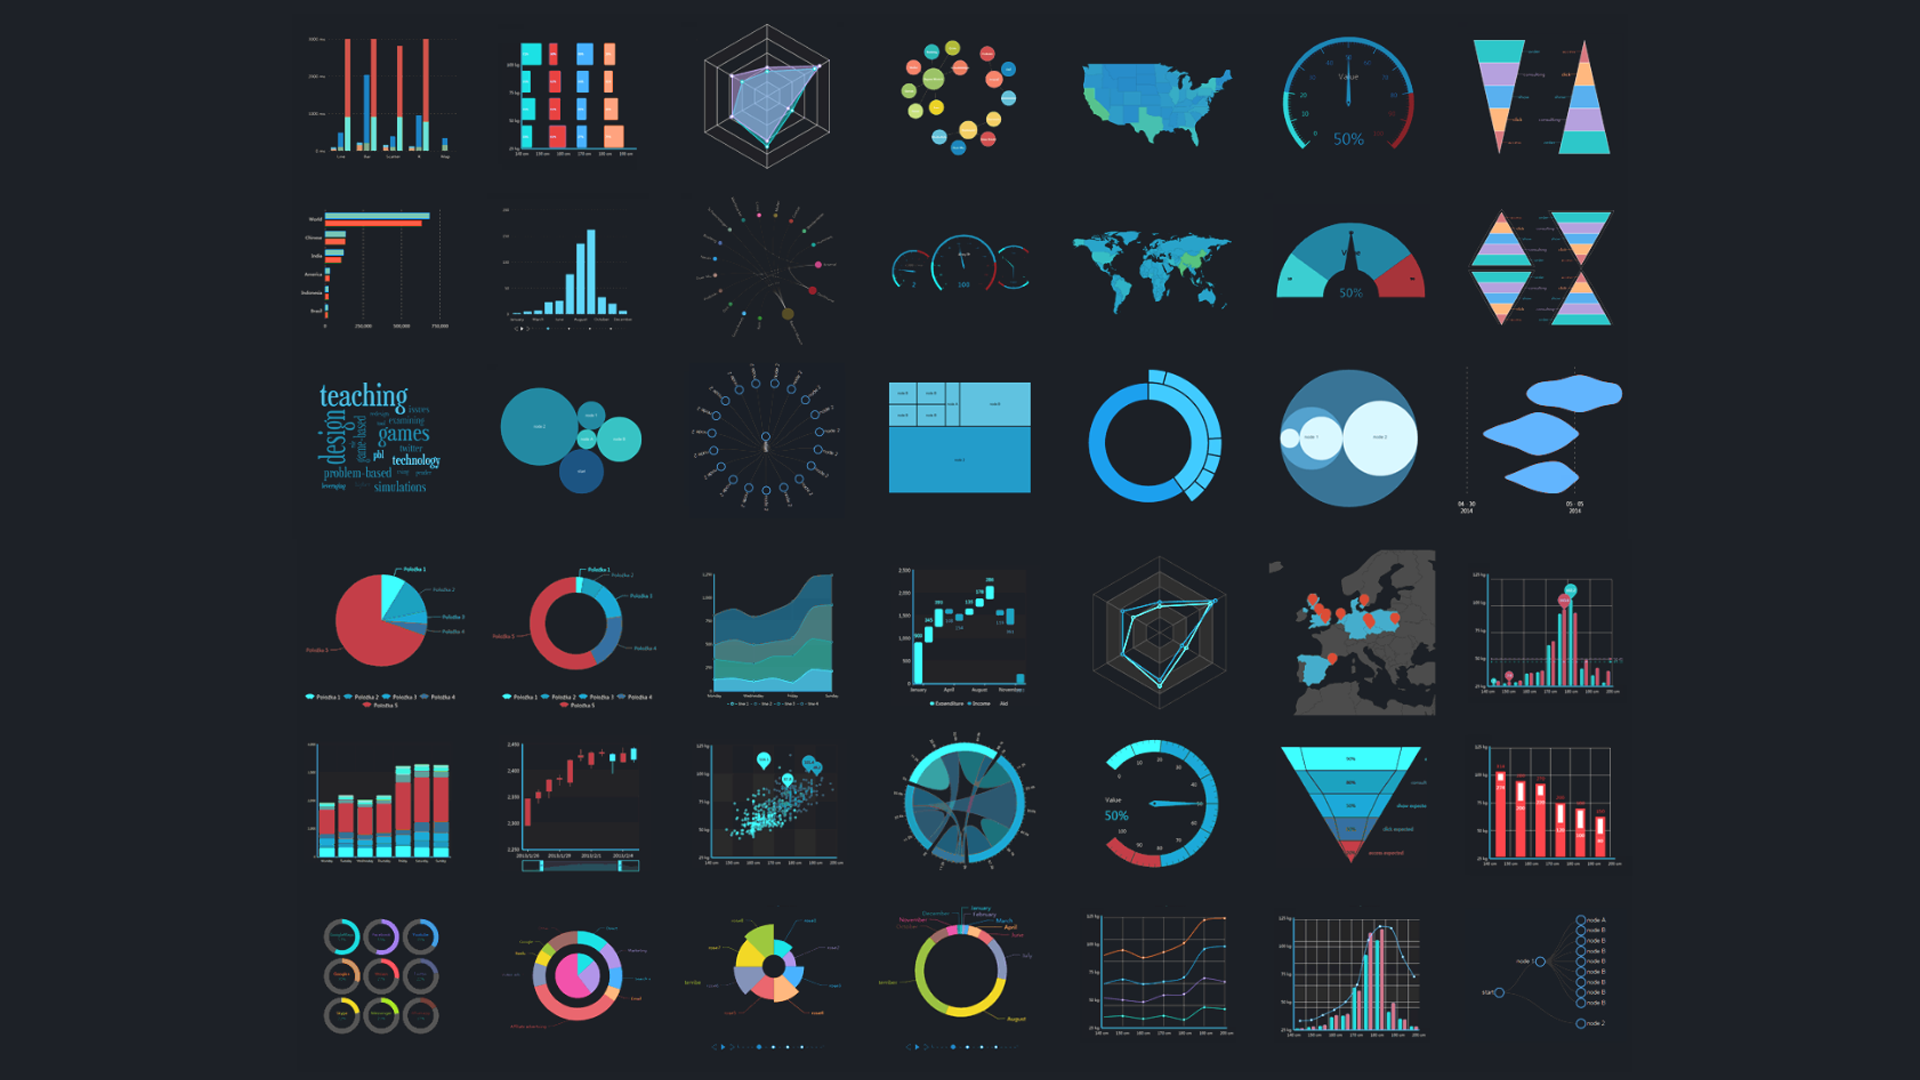
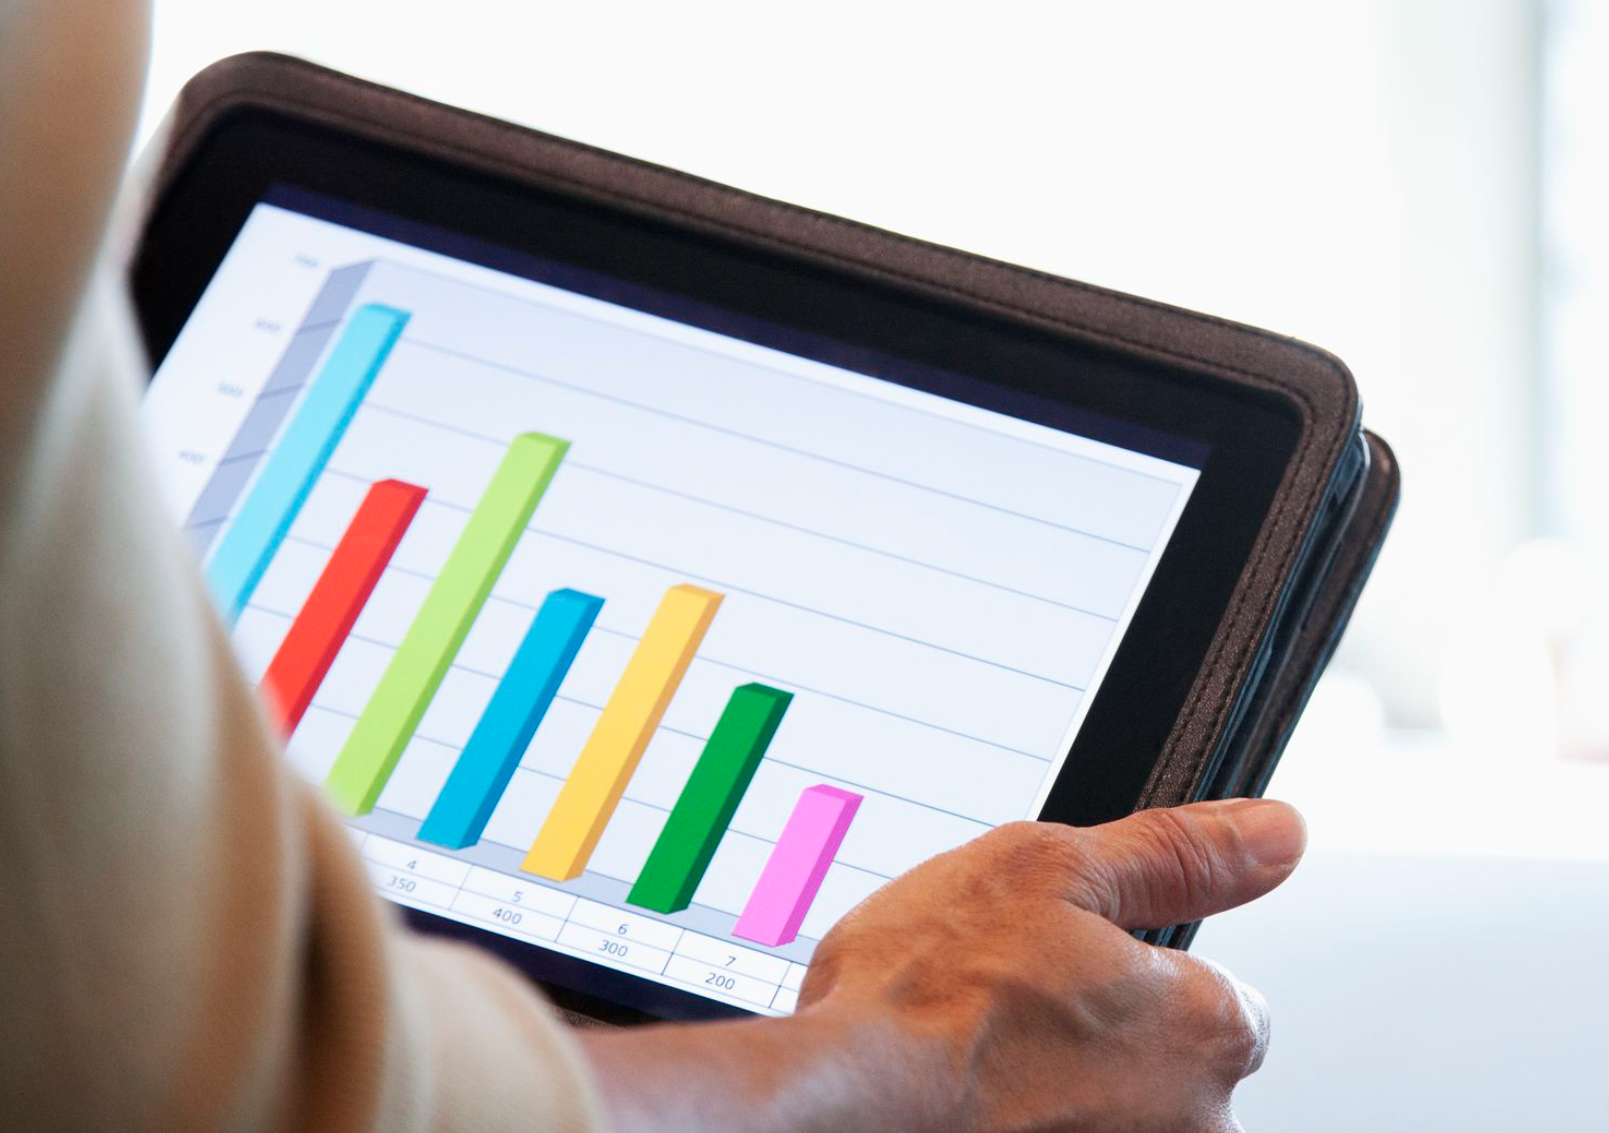
- Analytic Dashboards That Present Data Visually – Summarized data should be presented in graphs, pie charts, bar charts, icons and tables making it easy to understand and identify specific information and results. There should be the option to present the information in the way that is most appealing to those utilizing the dashboard, giving them the flexibility to include their own choice of icon, color and visual presentation of the data required.
- Monitor Multiple Data – Your dashboard should allow you to monitor and correlate a variety of data at the same time. It is imperative that you see the overall picture and how each metric impacts on each department or on the overall business.
- User Friendly – Some dashboards over complicate data which makes it hard to understand. An effective dashboard should be easy to read and have ease of functionality so that any
core staff member can access and utilize the data without the need for an in depth knowledge of IT or data management. - Accessibility – Dashboards should be easy to access and share through internal systems or cloud software. Users should be able to provide shareable links and the dashboard should be compatible with computer monitors, TV’s or mobile devices.
- Automated Reporting – Dashboards should create targeted reports at the touch of a button. Regardless of the time of the month, your dashboard should be able to create any type of
report on any piece of data or KPI. This is a huge time saving option where in the past users would need to source and collate information from various departments and resources. A professional dashboard should do this at your request, giving the flexibility to determine not only the data required but to report by any specific date, time or other metric.
Do I Really Need an Analytics Dashboard?
Whether you are a small concern or multi departmental business, the benefits of investing in an analytics dashboard as a resource are numerous. Manually accessing, sorting, collating and analyzing data from the entire range of resources that your business uses is neither time nor cost effective. Data dashboards allow modern businesses to gain answers at the touch of a button. With the growth in flexible and remote working and the fast paced competitive business environment we now find ourselves in, businesses need to access and react to core information more effectively and speedily than ever before. By embracing this revolutionary technology businesses are best equipped to deal with the ever changing influences in modern day commercialism.